Robert Hatch Creek - 197912 - Appendix
Site Location
PSCIS crossing 197912 is located on Robert Hatch Creek near Topley, BC. PSCIS crossing 197912 is located on a small private road and the Hatch Creek Ranch. Crossing 197912 was located 2.6km upstream from the confluence with Richfield Creek. Crossing 198043 is the responsibility of the range tenure holder (Hatch Creek Ranch Ltd. - forest file id RAN074136 and Groot Bros. Contracting Ltd. - forest file id RANM01180) where the road is located.
Background
At crossing 197912, Robert Hatch Creek is a fourth order stream with a watershed area upstream of the crossing of approximately 31.5km2. The elevation of the watershed ranges from a maximum of 1070m to 715m near the crossing (Table 5.36). No fish have previously been recorded at the site (MoE 2020b; Norris 2020).
fpr::fpr_table_wshd_sum(site_id = my_site) %>%
  fpr::fpr_kable(caption_text = paste0('Summary of derived upstream watershed statistics for PSCIS crossing ', my_site, '.'),
           footnote_text = 'Elev P60 = Elevation at which 60% of the watershed area is above',
scroll = F)| Site | Area Km | Elev Site | Elev Min | Elev Max | Elev Median | Elev P60 | Aspect |
|---|---|---|---|---|---|---|---|
| 197912 | 31.5 | 720 | 715 | 1070 | 1004 | 983 | S |
| * Elev P60 = Elevation at which 60% of the watershed area is above |
Extensive background on Richfield Creek is presented in Irvine (2021) with fish sampling and orthoimagery available within the “Richfield Creek - 197662 - Appendix” within this document.
PSCIS stream crossing 198043 was ranked as a high priority for follow up by Canadian Wildlife Federation because of the relatively large size of the stream and habitat rated as high value in PSCIS (Table 5.37. A map of the watershed is provided in map attachment 093L.115.
| Habitat | Potential | Remediation Gain | Remediation Gain (%) |
|---|---|---|---|
| ST Network (km) | 63.7 | 55.6 | 87 |
| ST Lake Reservoir (ha) | 2.5 | 2.4 | 96 |
| ST Wetland (ha) | 198.5 | 198.5 | 100 |
| ST Slopeclass03 Waterbodies (km) | 8.7 | 0.0 | 0 |
| ST Slopeclass03 (km) | 26.8 | 26.8 | 100 |
| ST Slopeclass05 (km) | 18.8 | 15.1 | 80 |
| ST Slopeclass08 (km) | 7.0 | 3.1 | 44 |
| ST Spawning (km) | 6.7 | 6.7 | 100 |
| ST Rearing (km) | 9.3 | 9.3 | 100 |
| CH Spawning (km) | 6.7 | 6.7 | 100 |
| CH Rearing (km) | 7.8 | 7.8 | 100 |
| CO Spawning (km) | 11.3 | 11.3 | 100 |
| CO Rearing (km) | 27.7 | 27.7 | 100 |
| CO Rearing (ha) | 104.4 | 104.4 | 100 |
| SK Spawning (km) | 0.0 | 0.0 | – |
| SK Rearing (km) | 0.0 | 0.0 | – |
| SK Rearing (ha) | – | 0.0 | – |
| All Spawning (km) | 11.3 | 11.3 | 100 |
| All Rearing (km) | 28.2 | 28.2 | 100 |
| All Spawning Rearing (km) | 28.2 | 28.2 | 100 |
| * Model data is preliminary and subject to adjustments. |
Stream Characteristics at Crossing
At the time of the survey, PSCIS crossing 197912 was comprised of a collapsing bridge (Table 5.38). The structure may have been presenting an impediment to upstream fish passage for adult fish and the bridge debris in the channel was resulting in erosion of the banks adjacent to the historic structure. Water temperature was 12\(^\circ\)C, pH was 8 and conductivity was 283uS/cm. Surveys were conducted with a remotely piloted aircraft immediately upstream and downstream of the crossing with resulting images stitched into an orthomosaic and 3-dimensional model presented in Figures 5.53 - 5.54.
| Location and Stream Data |
|
Crossing Characteristics | – |
|---|---|---|---|
| Date | 2021-08-31 | Crossing Sub Type | Bridge |
| PSCIS ID | 197912 | Diameter (m) | 12 |
| External ID | – | Length (m) | 7 |
| Crew | AI | Embedded | – |
| UTM Zone | 9 | Depth Embedded (m) | – |
| Easting | 670963 | Resemble Channel | – |
| Northing | 6046221 | Backwatered | – |
| Stream | Robert Hatch Creek | Percent Backwatered | – |
| Road | Private | Fill Depth (m) | – |
| Road Tenure | Unclassified | Outlet Drop (m) | – |
| Channel Width (m) | – | Outlet Pool Depth (m) | – |
| Stream Slope (%) | – | Inlet Drop | – |
| Beaver Activity | – | Slope (%) | – |
| Habitat Value | – | Valley Fill | – |
| Final score | 0 | Barrier Result | Passable |
| Fix type | – | Fix Span / Diameter | – |
Photos: From top left clockwise: Road/Site Card, Barrel, Outlet, Downstream, Upstream, Inlet.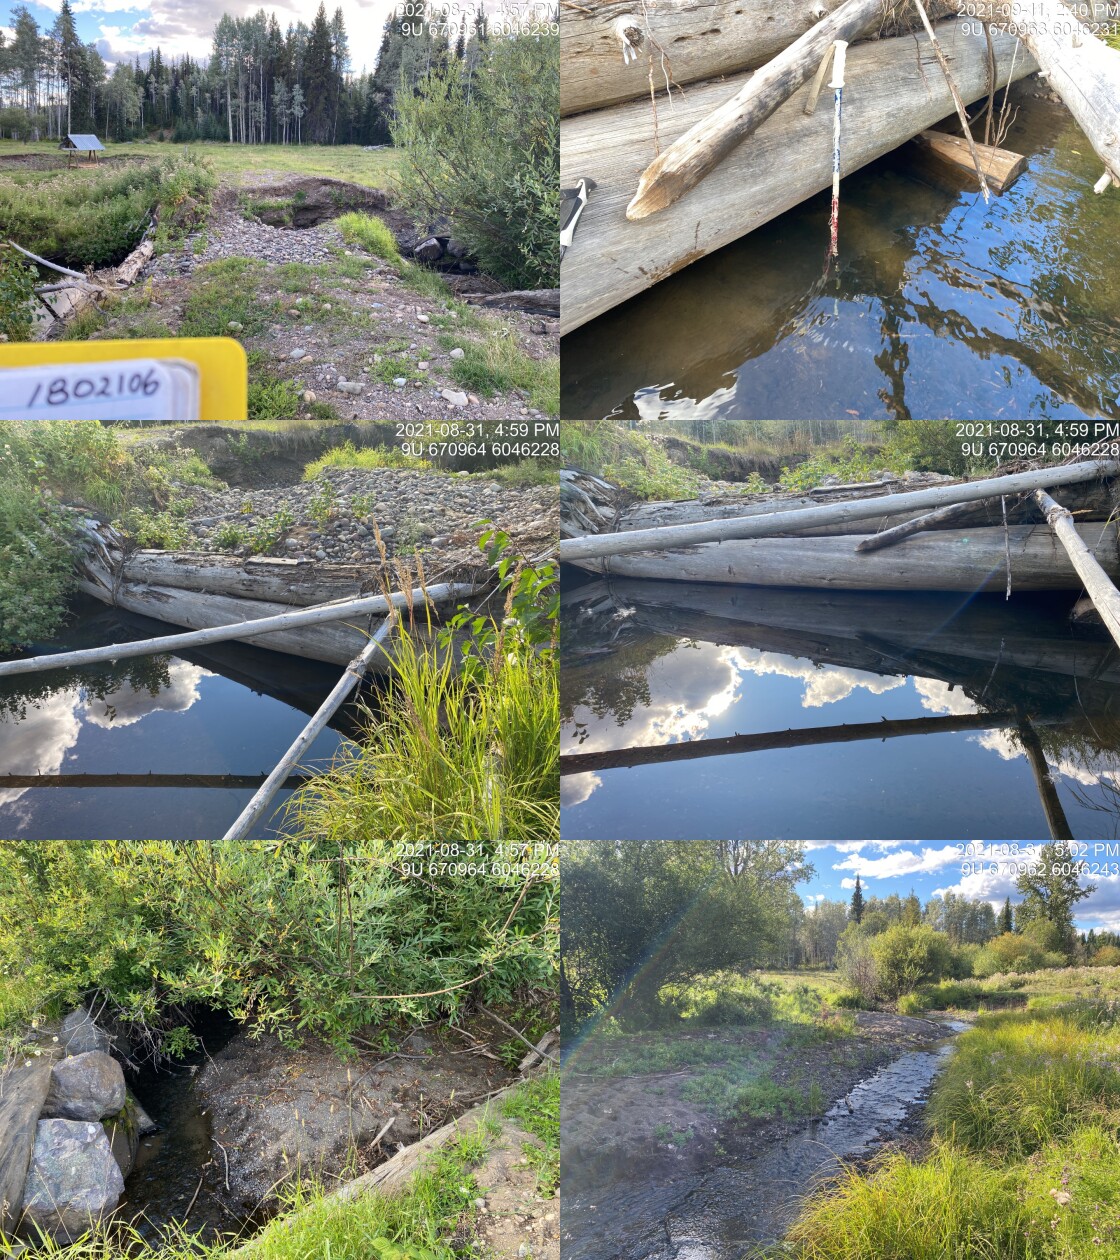
|
|||
| Comments: Bridge has collapsed and is impediment to upstream fish passage. Habitat confirmation conducted. 16:56 |
model_url <- '<iframe src="https://www.mapsmadeeasy.com/maps/public/aebd400d8dbe455eb3806b1ca8a4c496" scrolling="no" title="Maps Made Easy" width="100%" height="600" frameBorder ="0"></iframe>'

knitr::asis_output(model_url)
my_photo = 'fig/pixel.png'
my_caption = paste0('Orthomosaic of habitat immediately upstream and downstream of Robert Hatch Creek.')
knitr::include_graphics(my_photo, dpi = NA)Figure 5.53: Orthomosaic of habitat immediately upstream and downstream of Robert Hatch Creek.
model_url <- '<iframe src="https://www.mapsmadeeasy.com/maps/public_3D/aebd400d8dbe455eb3806b1ca8a4c496" scrolling="no" title="Maps Made Easy" width="100%" height="600" frameBorder ="0"></iframe>'

knitr::asis_output(model_url)
my_photo = 'fig/pixel.png'
my_caption = paste0('3D model of habitat immediately upstream and downstream of Robert Hatch Creek. To zoom press "shift" and scroll.')
knitr::include_graphics(my_photo, dpi = NA)Figure 5.54: 3D model of habitat immediately upstream and downstream of Robert Hatch Creek. To zoom press “shift” and scroll.
Stream Characteristics Downstream
The stream was surveyed downstream from the culvert for 300m (Figures 5.57 - 5.58). Total cover amount was rated as with deep pools dominant. Cover was also present as small woody debris, large woody debris, undercut banks, and overhanging vegetation (Table 5.39). The average channel width was 4.7m, the average wetted width was 3.2m and the average gradient was 1.2%. The dominant substrate was gravels with fines subdominant. The habitat was rated as medium value for salmonid rearing and spawning.
Stream Characteristics Upstream of 197912
The stream was surveyed immediately upstream from 197912 for approximately 340m to the location of a large beaver dam (Figures 5.59 - 5.60). Within the area surveyed, total cover amount was rated as with deep pools dominant. Cover was also present as small woody debris, large woody debris, undercut banks, overhanging vegetation, and instream vegetation (Table 5.39). The average channel width was 4.3m, the average wetted width was 2.5m and the average gradient was 1.5%. The dominant substrate was gravels with fines subdominant. Habitat value was rated as high value for resident salmonid rearing and spawning.
Fish Sampling
Electrofishing was conducted downstream of the collapsed bridge with results summarised in Tables 5.40 - 5.41 and Figure 5.56.
Structure Remediation and Cost Estimate
Should restoration/maintenance activities proceed at the site, removal of PSCIS crossing 197912 is recommended. In addition to removal of the collapsed bridge, resloping of banks and the installation of live cuttings/pegboarding is recommended in three areas downstream where cattle trampling is resulting in significant erosion. A map of the erosion areas and associated prescriptions for rehabilitation of the downstream corners is provided as Figure 5.55. The cost of the work is estimated at $30,000 for a cost benefit of 924 linear m/$1000 and 3973.2 m2/$1000.
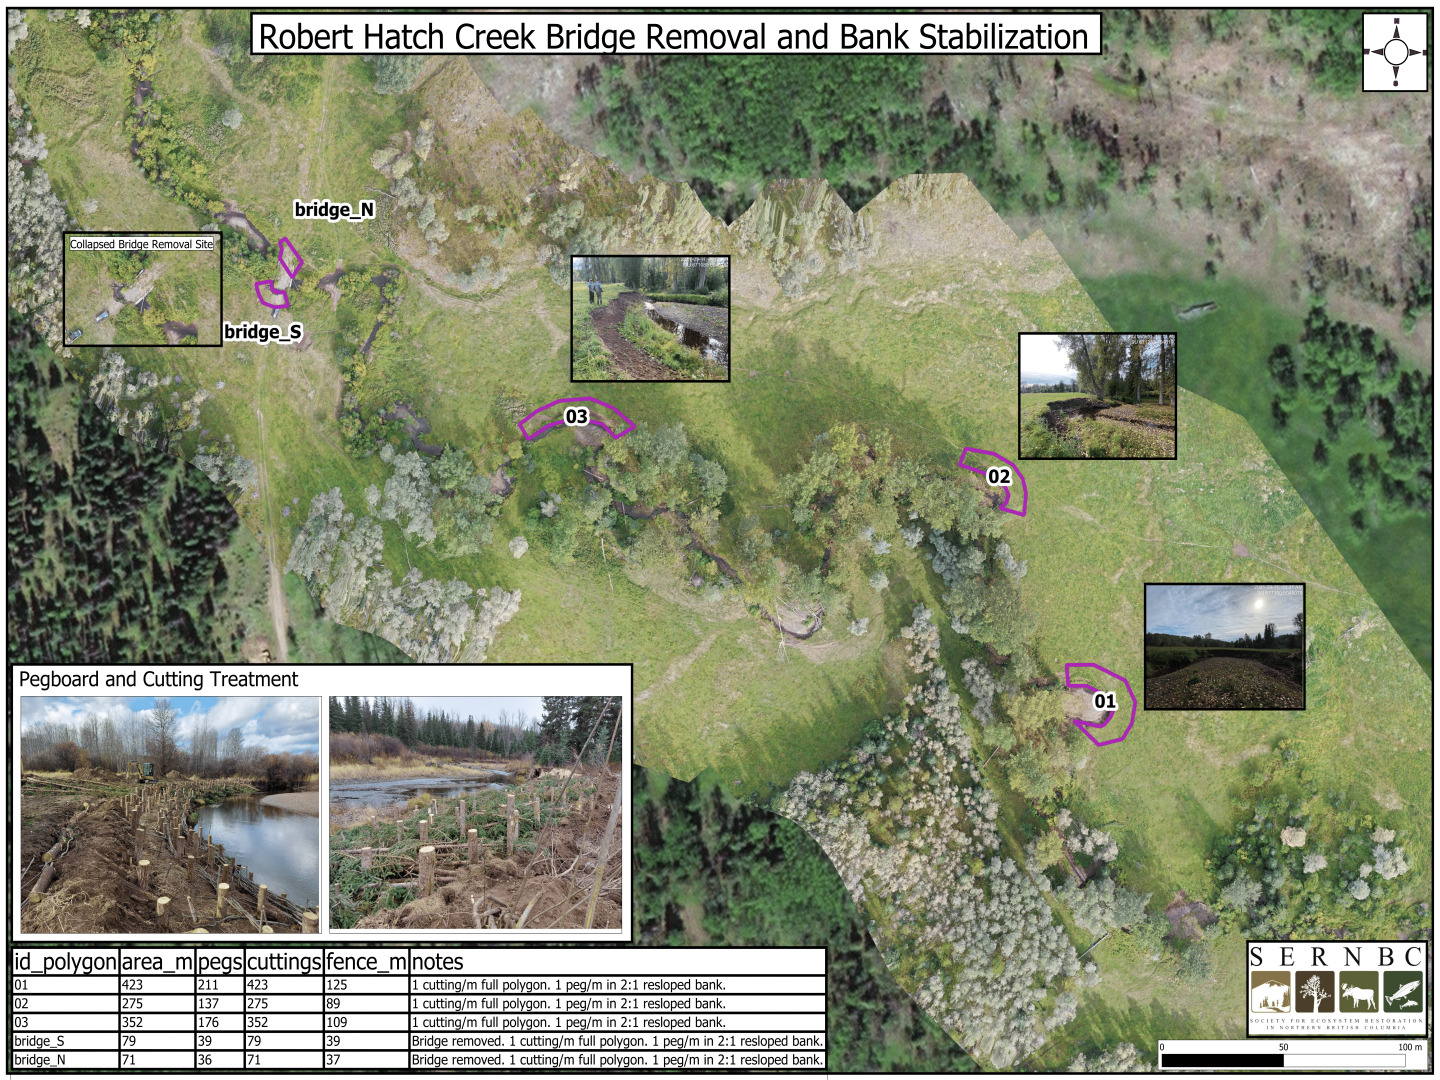
Figure 5.55: Restoration plan for Robert Hatch Creek including removal of collapsed bridge, resloping of banks and the installation of live cuttings/pegboarding
Conclusion
There was 197912 is 27.7km of habitat modelled upstream of crossing with areas surveyed rated as high value for salmonid rearing and spawning. Crossing 197912 was ranked as a moderate priority for proceeding to design for removal. As Robert Hatch Creek appears to be a high value fish stream with significant impacts due to adjacent land use (cattle trampled banks and grazed/removed riparian vegetation), it is recommended that a plan be developed to work with adjacent landowners and tenure holders to exclude cattle from the riparian area, implement stream restoration actions and explore possibilities related to progressive beaver management in the watershed.
tab_hab_summary %>%
  filter(Site  == my_site) %>%
  # select(-Site) %>%
  fpr::fpr_kable(caption_text = paste0('Summary of habitat details for PSCIS crossing ', my_site, '.'),
scroll = F) | Site | Location | Length Surveyed (m) | Channel Width (m) | Wetted Width (m) | Pool Depth (m) | Gradient (%) | Total Cover | Habitat Value |
|---|---|---|---|---|---|---|---|---|
| 197912 | Downstream | 300 | 4.7 | 3.2 | 0.5 | 1.2 | – | medium |
| 197912 | Upstream | 340 | 4.3 | 2.5 | 0.6 | 1.5 | abundant | high |
| site | passes | ef_length_m | ef_width_m | area_m2 | enclosure |
|---|---|---|---|---|---|
| 197912_ds_ef1 | 3 | 8.6 | 4.80 | 41.3 | Closed |
| 197912_ds_ef2 | 1 | 28.0 | 1.96 | 54.9 | Open |
| 197912_ds_ef3 | 1 | 14.0 | 2.87 | 40.2 | Open |
| local_name | species_code | life_stage | catch | density_100m2 | nfc_pass |
|---|---|---|---|---|---|
| 197912_ds_ef1 | NFC | – | 0 | 0.0 | TRUE |
| 197912_ds_ef1 | RB | adult | 1 | 2.4 | TRUE |
| 197912_ds_ef2 | RB | fry | 1 | 1.8 | FALSE |
| 197912_ds_ef3 | RB | fry | 1 | 2.5 | FALSE |
| 197912_ds_ef3 | RB | adult | 1 | 2.5 | FALSE |
|
* nfc_pass FALSE means fish were captured in final pass indicating more fish of this species/lifestage may have remained in site. Mark-recaptured required to reduce uncertainties. |
my_caption <- paste0('Densites of fish (fish/100m2) captured downstream of PSCIS crossing ', my_site, '.')

fpr_plot_fish_box() 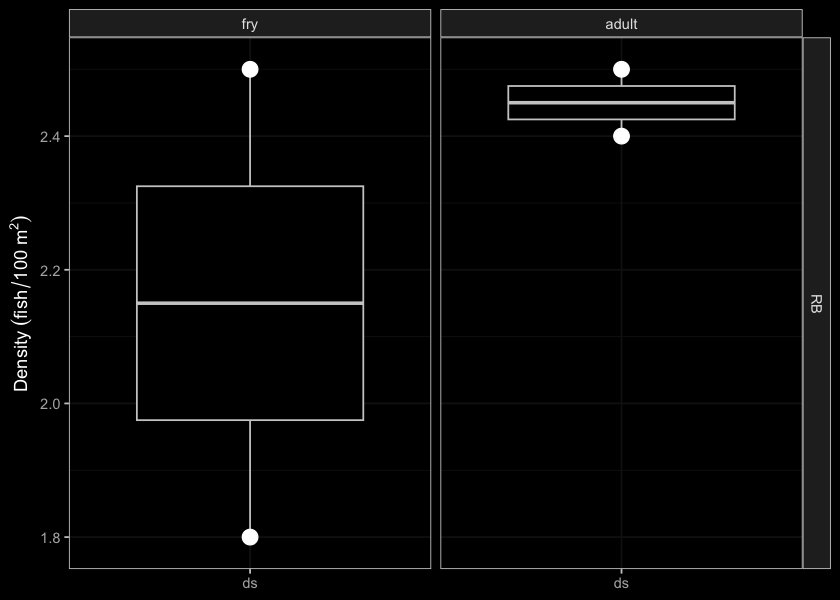
Figure 5.56: Densites of fish (fish/100m2) captured downstream of PSCIS crossing 197912.
my_photo1 = fpr::fpr_photo_pull_by_str(str_to_pull = '_d1_')

my_caption1 = paste0('Typical habitat downstream of PSCIS crossing ', my_site, '.')


# fpr::fpr_photo_flip(site_id = 1802488, str_to_pull = '6257')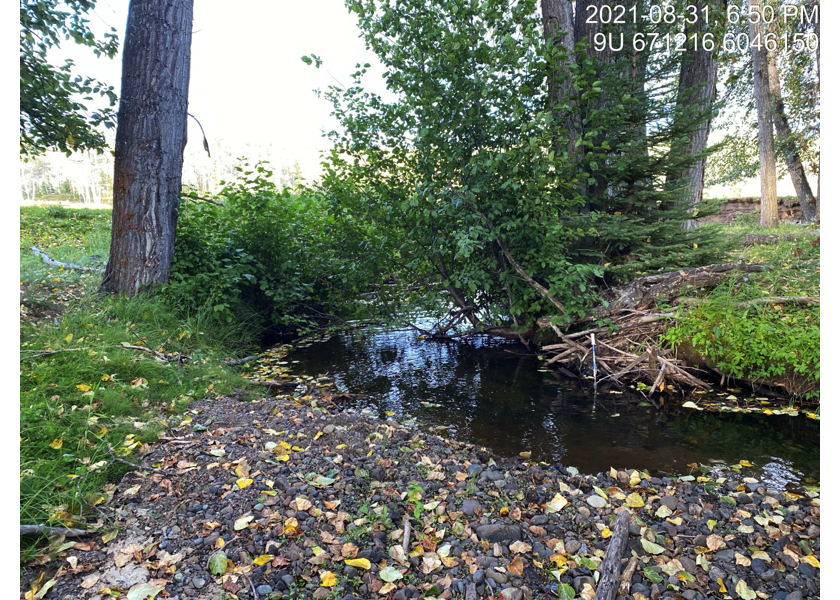
Figure 5.57: Typical habitat downstream of PSCIS crossing 197912.
my_photo2 = fpr::fpr_photo_pull_by_str(str_to_pull = '_d2_')

my_caption2 = paste0('Typical habitat downstream of PSCIS crossing ', my_site, '.')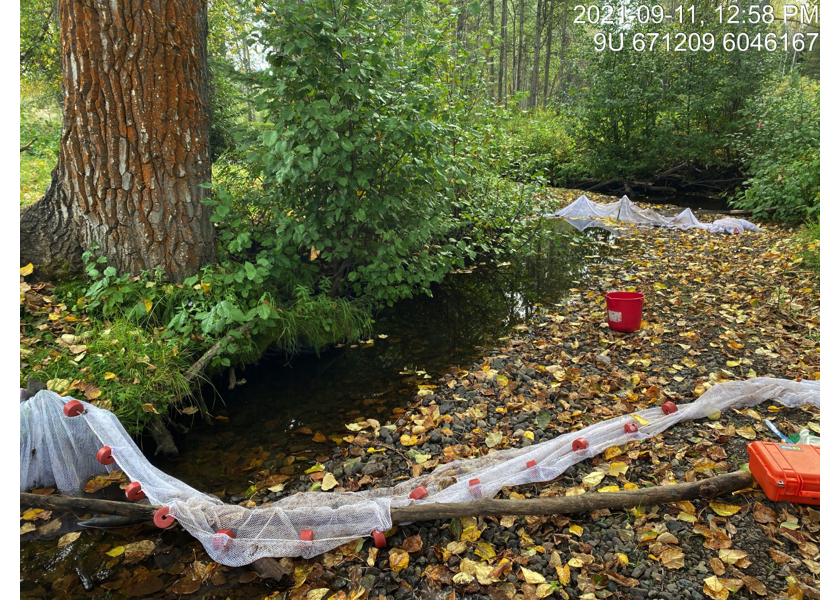
Figure 5.58: Typical habitat downstream of PSCIS crossing 197912.
my_caption <- paste0('Left: ', my_caption1, ' Right: ', my_caption2)

knitr::include_graphics(my_photo1)
knitr::include_graphics("fig/pixel.png")
knitr::include_graphics(my_photo2)
my_photo1 = fpr::fpr_photo_pull_by_str(str_to_pull = '_u1_')
my_caption1 = paste0('Typical habitat upstream of PSCIS crossing ', my_site, '.')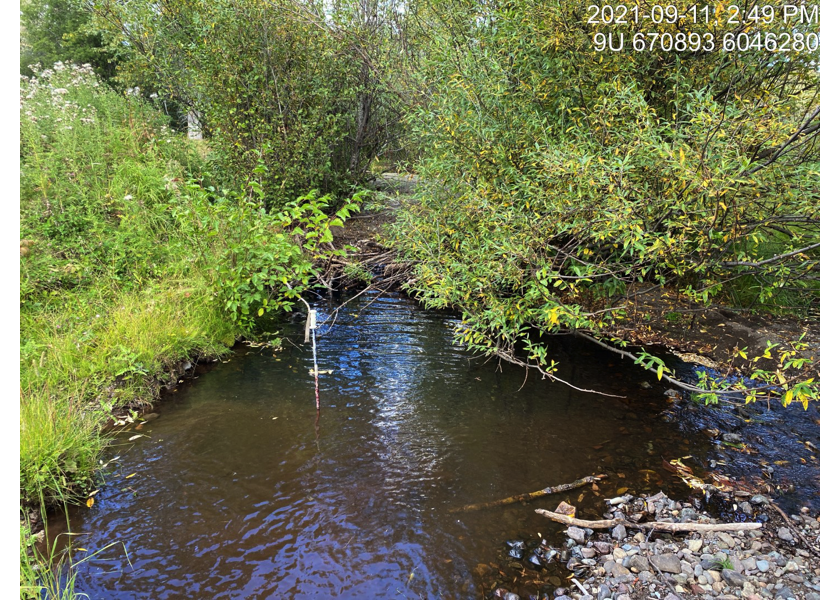
Figure 5.59: Typical habitat upstream of PSCIS crossing 197912.
my_photo2 = fpr::fpr_photo_pull_by_str(str_to_pull = '_u2_')

my_caption2 = paste0('Typical habitat upstream of PSCIS crossing ', my_site, '.')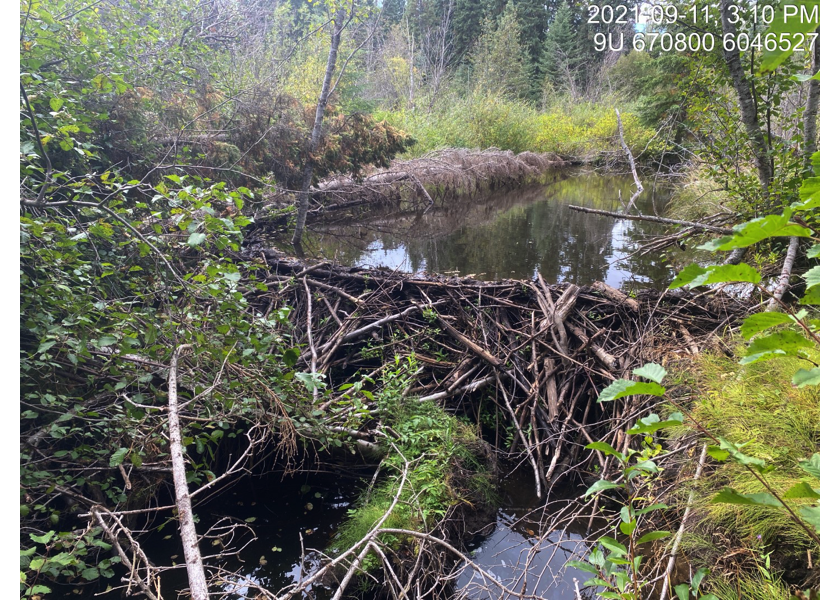
Figure 5.60: Typical habitat upstream of PSCIS crossing 197912.
my_caption <- paste0('Left: ', my_caption1, ' Right: ', my_caption2)

knitr::include_graphics(my_photo1)
knitr::include_graphics("fig/pixel.png")
knitr::include_graphics(my_photo2)