4 Results and Discussion
Results of Phase 1 assessments, Bulkley Falls assessment and Phase 2 assessments are summarized in Figure 4.1 with additional details provided in sections below.
##make colors for the priorities
pal <-
   colorFactor(palette = c("red", "yellow", "grey", "black"),
               levels = c("high", "moderate", "low", "no fix"))

pal_phase1 <-
   colorFactor(palette = c("red", "yellow", "grey", "black"),
               levels = c("high", "moderate", "low", NA))

# tab_map_phase2 <- tab_map %>% filter(source %like% 'phase2')
#https://stackoverflow.com/questions/61026700/bring-a-group-of-markers-to-front-in-leaflet
# marker_options <- markerOptions(
#   zIndexOffset = 1000)
tracks <- sf::read_sf("./data/habitat_confirmation_tracks.gpx", layer = "tracks")


wshd_study_areas <- sf::read_sf('data/fishpass_mapping/wshd_study_areas.geojson')
  # st_transform(crs = 4326)


map <- leaflet(height=500, width=780) %>%
  addTiles()  %>%
  # leafem::addMouseCoordinates(proj4 = 26911) %>% ##can't seem to get it to render utms yet
  # addProviderTiles(providers$"Esri.DeLorme") %>%
  addProviderTiles("Esri.WorldTopoMap", group = "Topo") %>%
  addProviderTiles("Esri.WorldImagery", group = "ESRI Aerial") %>%
  addPolygons(data = wshd_study_areas %>% filter(watershed_group_code == 'BULK'), color = "#F29A6E", weight = 1, smoothFactor = 0.5,
              opacity = 1.0, fillOpacity = 0,
              fillColor = "#F29A6E", label = 'Bulkley River') %>%
  addPolygons(data = wshd_study_areas %>% filter(watershed_group_code == 'MORR'), color = "#C39D50", weight = 1, smoothFactor = 0.5,
              opacity = 1.0, fillOpacity = 0,
              fillColor = "#C39D50", label = 'Morice River') %>%
  addPolygons(data = wshds, color = "#0859C6", weight = 1, smoothFactor = 0.5,
              opacity = 1.0, fillOpacity = 0.25,
              fillColor = "#00DBFF",
              label = wshds$stream_crossing_id,
              popup = leafpop::popupTable(x = select(wshds %>% st_set_geometry(NULL),
                                                     Site = stream_crossing_id,
                                                     elev_min:area_km),
                                          feature.id = F,
                                          row.numbers = F),
              group = "Phase 2") %>%
  addLegend(
    position = "topright",
    colors = c("red", "yellow", "grey", "black"),
    labels = c("High", "Moderate", "Low", 'No fix'), opacity = 1,
    title = "Fish Passage Priorities") %>%
#   # addCircleMarkers(
#   # data=tab_plan_sf,
#   # label = tab_plan_sf$Comments,
#   # labelOptions = labelOptions(noHide = F, textOnly = F),
#   # popup = leafpop::popupTable(x = tab_plan_sf %>% st_drop_geometry(),
#   #                             feature.id = F,
#   #                             row.numbers = F),
#   # radius = 9,
#   # fillColor = ~pal_phase1(tab_plan_sf$Priority),
#   # color= "#ffffff",
#   # stroke = TRUE,
#   # fillOpacity = 1.0,
# # weight = 2,
# # opacity = 1.0,
# # group = "Planning") %>%
addCircleMarkers(data=tab_map %>%
                   filter(source %like% 'phase1' | source %like% 'pscis_reassessments'),
                 label = tab_map %>% filter(source %like% 'phase1' | source %like% 'pscis_reassessments') %>% pull(pscis_crossing_id),
                 # label = tab_map$pscis_crossing_id,
                 labelOptions = labelOptions(noHide = F, textOnly = TRUE),
                 popup = leafpop::popupTable(x = select((tab_map %>% st_set_geometry(NULL) %>% filter(source %like% 'phase1' | source %like% 'pscis_reassessments')),
                                                        Site = pscis_crossing_id, Priority = priority_phase1, Stream = stream_name, Road = road_name, `Habitat value`= habitat_value, `Barrier Result` = barrier_result, `Culvert data` = data_link, `Culvert photos` = photo_link, `Model data` = model_link),
                                             feature.id = F,
                                             row.numbers = F),
                 radius = 9,
                 fillColor = ~pal_phase1(priority_phase1),
                 color= "#ffffff",
                 stroke = TRUE,
                 fillOpacity = 1.0,
                 weight = 2,
                 opacity = 1.0,
                 group = "Phase 1") %>%
  addPolylines(data=tracks,
               opacity=0.75, color = '#e216c4',
               fillOpacity = 0.75, weight=5, group = "Phase 2") %>%

addAwesomeMarkers(
    lng = photo_metadata$gps_longitude,
    lat = photo_metadata$gps_latitude,
    popup = leafpop::popupImage(photo_metadata$url, src = "remote"),
    clusterOptions = markerClusterOptions(),
    group = "Phase 2") %>%

  addCircleMarkers(
    data=tab_hab_map,
    label = tab_hab_map$pscis_crossing_id,
    labelOptions = labelOptions(noHide = T, textOnly = TRUE),
    popup = leafpop::popupTable(x = select((tab_hab_map %>% st_drop_geometry()),
                                           Site = pscis_crossing_id,
                                           Priority = priority,
                                           Stream = stream_name,
                                           Road = road_name,
                                           `Habitat (m)`= upstream_habitat_length_m,
                                           Comments = comments,
                                           `Culvert data` = data_link,
                                           `Culvert photos` = photo_link,
                                           `Model data` = model_link),
                                feature.id = F,
                                row.numbers = F),
    radius = 9,
    fillColor = ~pal(priority),
    color= "#ffffff",
    stroke = TRUE,
    fillOpacity = 1.0,
    weight = 2,
    opacity = 1.0,
    group = "Phase 2"
    ) %>%

  addLayersControl(
    baseGroups = c(
      "Esri.DeLorme",
      "ESRI Aerial"),
    overlayGroups = c("Phase 1", "Phase 2"),
    options = layersControlOptions(collapsed = F)) %>%
  leaflet.extras::addFullscreenControl() %>%
  addMiniMap(tiles = providers$"Esri.NatGeoWorldMap",
             zoomLevelOffset = -6, width = 100, height = 100)

map %>%
  hideGroup(c("Phase 1"))
Figure 4.1: Map of fish passage and habitat confirmation results
## Planning

# Following review of background literature, fisheries information, PSCIS and `bcfishpass` outputs, `r tab_plan_sf %>% nrow()` modelled and PSCIS crossings were reviewed to select sites for follow up with Phase 1 and 2 assessments in the Morice River watershed.   `r tab_plan_sf %>% filter(Priority == 'high') %>%  nrow()` crossings ranked as high priority for future follow up with Phase 1 and/or Phase 2 assessments, `r tab_plan_sf %>% filter(Priority == 'moderate') %>%  nrow()` crossings ranked as moderate priorities, and `r tab_plan_sf %>% filter(Priority == 'low') %>%  nrow()` crossings ranked as low priorities. Georeferenced field maps are presented in `r if(gitbook_on){knitr::asis_output("[here](https://hillcrestgeo.ca/outgoing/fishpassage/projects/bulkley/) and available for bulk download as [Attachment 1](https://hillcrestgeo.ca/outgoing/fishpassage/projects/bulkley/bulkley_2021-04-21.zip).")} else knitr::asis_output("[Attachment 1](https://hillcrestgeo.ca/outgoing/fishpassage/projects/bulkley/bulkley_2021-04-21.zip).")`
conn <- rws_connect("data/bcfishpass.sqlite")
rws_disconnect(conn)
# Results are `r if(html_on)knitr::asis_output("presented in Figure \\@ref(fig:map-interactive) and ")`included as a zipped Google Earth kml file ([Attachment 1](https://github.com/NewGraphEnvironment/fish_passage_skeena_2021_reporting/raw/master/data/Attachment_1_morice_planning_kml.zip)).
# ## Planning
# Review of the PSCIS database indicated that prior to 2020, `r pscis_historic %>% filter(study_area %ilike% 'elk' & assessment_date < '2020-01-01') %>% nrow()` assessments for fish passage (Phase 1) and `r pscis_historic_phase2 %>% filter(study_area %ilike% 'elk' & assmt_date < '2020-01-01') %>% nrow()` habitat confirmations (Phase 2) have been conducted at crossing structures within the Upper Elk River. Within the Flathead River watershed `r pscis_historic %>% filter(study_area %ilike% 'flathead' & assessment_date < '2020-01-01') %>% nrow()` fish passage assessments and `r pscis_historic_phase2 %>% filter(study_area %ilike% 'flathead' & assmt_date < '2020-01-01') %>% nrow() %>% english::as.english()` habitat confirmations had been conducted. Following review of background literature, fisheries information, PSCIS and `bcfishpass` outputs, both modelled and PSCIS sites were selected for follow up with Phase 1 and 2 assessments. Results are included as a zipped package of Google Earth kml files stored [here](https://github.com/NewGraphEnvironment/fish_passage_elk_2020_reporting_cwf/raw/master/data/planning_kmls/elk_planning_kmls.zip).
## Planning
# Following review of background literature, fisheries information, PSCIS and `bcfishpass` outputs, both modelled and PSCIS sites were selected for follow up with Phase 1 and 2 assessments. Results are included as a zipped package of Google Earth kml files stored [here](https://github.com/NewGraphEnvironment/fish_passage_skeena_2021_reporting/raw/master/data/planning_kmls/elk_planning_kmls.zip).4.1 Phase 1
Field assessments were conducted between August 09 2021 and September 16 2021 by Allan Irvine, R.P.Bio. and Kyle Prince, P.Biol., Tieasha Pierre, Vern Joseph, Dallas Nikal, Alexandria Nikal, Chad Lewis, Tim Wilson, Adam Wrench, Lars Reese-Hanson and Don Morgan. A total of 191 Phase 1 assessments were conducted with 77 crossings considered “passable”, 10 crossings considered “potential” barriers and 84 crossings considered “barriers” according to threshold values based on culvert embedment, outlet drop, slope, diameter (relative to channel size) and length (MoE 2011a). Additionally, although all were considered fully passable, 20 crossings assessed were fords and ranked as “unknown” according to the provincial protocol. Georeferenced field maps are presented here and available for bulk download as Attachment 1. A summary of crossings assessed, a cost benefit analysis and priority ranking for follow up for Phase 1 sites presented in Table 4.1. Detailed data with photos are presented in Appendix - Phase 1 Fish Passage Assessment Data and Photos.
“Barrier” and “Potential Barrier” rankings used in this project followed MoE (2011a) and reflect an assessment of passability for juvenile salmon or small resident rainbow trout at any flows potentially present throughout the year (Clarkin et al. 2005 ; Bell 1991; Thompson 2013). As noted in Bourne et al. (2011), with a detailed review of different criteria in Kemp and O’Hanley (2010), passability of barriers can be quantified in many different ways. Fish physiology (i.e. species, length, swim speeds) can make defining passability complex but with important implications for evaluating connectivity and prioritizing remediation candidates (Bourne et al. 2011; Shaw et al. 2016; Mahlum et al. 2014; Kemp and O’Hanley 2010). Washington Department of Fish & Wildlife (2009) present criteria for assigning passability scores to culverts that have already been assessed as barriers in coarser level assessments. These passability scores provide additional information to feed into decision making processes related to the prioritization of remediation site candidates and have potential for application in British Columbia.
#`r if(identical(gitbook_on, FALSE)){knitr::asis_output("<br>")}`
# if(gitbook_on){
#   tab_cost_est_phase1 %>%
#   fpr::fpr_kable(caption_text = 'Upstream habitat estimates and cost benefit analysis for Phase 1 assessments.', scroll = gitbook_on)
# } else tab_cost_est_phase1 %>%
#   fpr::fpr_kable(scroll = F, caption_text = 'Upstream habitat estimates and cost benefit analysis for Phase 1 assessments.')

tab_cost_est_phase1 %>%
  fpr::fpr_kable(caption_text = 'Upstream habitat estimates and cost benefit analysis for Phase 1 assessments. Steelhead network model (total length stream network <20% gradient).',
scroll = gitbook_on)| PSCIS ID | External ID | Stream | Road | Result | Habitat value | Stream Width (m) | Priority | Fix | Cost Est ( $K) | Habitat Upstream (km) | Cost Benefit (m / $K) | Cost Benefit (m2 / $K) |
|---|---|---|---|---|---|---|---|---|---|---|---|---|
| 198048 | 1800048 | Cesford Creek | Highway 16 | Barrier | High | 5.48 | high | OBS | 6000 | 54.43 | 9.1 | 24.9 |
| 197967 | 1800050 | Taman Creek | Highway 16 | Barrier | Medium | 5.30 | mod | OBS | 18600 | 142.42 | 7.7 | 20.3 |
| 197903 | 1800180 | Tributary to Bulkley River | Rose Lake Cuttoff Road | Barrier | Low | 1.50 | low | SS-CBS | 160 | 3.67 | 22.9 | 17.2 |
| 198065 | 1800191 | Watson Creek | Montgomery Road | Barrier | Medium | 3.00 | mod | OBS | 800 | 18.77 | 23.5 | 35.2 |
| 198049 | 1800193 | Cesford Creek | Highway 118 | Barrier | High | 4.90 | high | OBS | 6000 | 50.46 | 8.4 | 20.6 |
| 197976 | 1800355 | Ailport Creek | Highway 16 | Barrier | High | 7.50 | high | OBS | 7500 | 53.15 | 7.1 | 26.6 |
| 197974 | 1800356 | Watson Creek | Highway 16 | Barrier | Low | 2.20 | low | OBS | 6000 | 21.24 | 3.5 | 3.9 |
| 197902 | 1800360 | Tributary to Bulkley River | Rose Lake Cuttoff Road | Barrier | Low | 1.50 | low | SS-CBS | 160 | 4.75 | 29.7 | 22.3 |
| 197904 | 1800372 | Tributary to Bulkley River | Crow Creek Road | Barrier | Low | 2.00 | low | OBS | 200 | 3.03 | 15.2 | 15.2 |
| 197975 | 1801122 | Ailport Creek | Private Driveway | Barrier | Medium | 6.50 | mod | OBS | 230 | 52.76 | 229.4 | 745.5 |
| 197972 | 1802040 | Tributary to Broman Lake | Powerline | Barrier | Low | 0.80 | low | SS-CBS | 40 | 7.78 | 194.5 | 77.8 |
| 198066 | 1802488 | Thompson Creek | Private Road | Potential | High | 2.77 | mod | OBS | 200 | 35.88 | 179.4 | 248.5 |
| 197907 | 1802611 | Tributary to Maxan Creek | Maxan Creek FSR | Barrier | Low | 1.30 | low | SS-CBS | 40 | 8.97 | 224.2 | 145.8 |
| 197908 | 1803697 | Tributary to Maxan Creek | Maxan Creek FSR | Barrier | Low | 1.00 | low | SS-CBS | 40 | 4.03 | 100.8 | 50.4 |
| 197906 | 1803706 | Tributary to Maxan Creek | Maxan Creek FSR | Barrier | Low | 1.20 | low | SS-CBS | 40 | 7.84 | 196.0 | 117.6 |
| 197970 | 1803813 | Tributary to Broman Lake | Broman Lake FSR | Barrier | Low | 0.70 | low | SS-CBS | 40 | 2.84 | 71.0 | 24.8 |
| 197909 | 1804693 | Tributary to Maxan Creek | Maxan Creek FSR | Barrier | Medium | 0.90 | mod | SS-CBS | 40 | 0.68 | 17.0 | 7.7 |
| 197964 | 1805529 | Bulkley River | Railway | Potential | High | 9.00 | mod | OBS | 8400 | 144.22 | 17.2 | 77.3 |
| 197963 | 1805531 | Tributary to Bulkley River | Railway | Barrier | Low | 4.00 | low | OBS | 6000 | 1.52 | 0.3 | 0.5 |
| 198044 | 1805573 | Tributary to Toboggan Creek | Railway | Barrier | Low | 2.00 | low | SS-CBS | 1200 | 10.09 | 8.4 | 8.4 |
| 198071 | 14000022 | Tributary to Collins Lake | spur Morice Nado | Barrier | Medium | 2.00 | mod | SS-CBS | 40 | 4.63 | 115.8 | 115.8 |
| 198069 | 14000256 | Tributary to Collins Lake | Morice Nado | Barrier | Medium | 2.50 | mod | OBS | 200 | 6.08 | 30.4 | 38.0 |
| 198037 | 14000375 | Tributary to Thautil River | Thautil FSR | Potential | Low | 0.65 | low | SS-CBS | 40 | 1.14 | 28.5 | 9.3 |
| 198036 | 14000377 | Tributary to Thaultil River | Thautil FSR | Barrier | Medium | 1.90 | mod | SS-CBS | 40 | 2.39 | 59.8 | 56.8 |
| 198039 | 14000379 | Tributary to Thautil River | Thautil FSR | Barrier | Low | 1.10 | low | SS-CBS | 40 | 6.01 | 150.2 | 82.6 |
| 198055 | 14000381 | Tributary to Thautil River | Thautil FSR | Barrier | Low | 1.10 | low | SS-CBS | 40 | 0.09 | 2.2 | 1.2 |
| 198038 | 14000382 | Tributary to Thautil River | Thautil FSR | Barrier | Low | 0.70 | low | SS-CBS | 40 | 1.27 | 31.8 | 11.1 |
| 198057 | 14000383 | Tributary to Gabriel Creek | Thautil FSR | Barrier | Medium | 3.00 | mod | OBS | 200 | 1.69 | 8.4 | 12.7 |
| 198056 | 14000389 | Tributary to Thautil River | Thautil FSR | Barrier | Low | 1.80 | low | SS-CBS | 40 | 2.09 | 52.2 | 47.0 |
| 198058 | 14000390 | Tributary to Gabriel Creek | Thautil FSR | Barrier | Low | 1.50 | low | SS-CBS | 40 | 1.13 | 28.2 | 21.2 |
| 198059 | 14000392 | Tributary to Gabriel Creek | Thautil FSR | Barrier | Medium | 1.50 | mod | SS-CBS | 40 | 2.85 | 71.2 | 53.4 |
| 198050 | 14000394 | Tributary to Thautil River | Thautil FSR | Barrier | Low | 0.90 | low | SS-CBS | 40 | 1.79 | 44.8 | 20.1 |
| 198033 | 14000395 | Tributary to Gabriel Creek | Thautil FSR | Barrier | Low | 0.67 | low | SS-CBS | 40 | 1.11 | 27.8 | 9.3 |
| 198035 | 14000398 | Tributary to Gabriel Creek | Thautil FSR | Barrier | Low | 1.17 | low | SS-CBS | 40 | 1.21 | 30.2 | 17.7 |
| 198011 | 14000443 | Tributary to Nanika River | 4 Road | Barrier | Low | 2.20 | low | OBS | 200 | 0.42 | 2.1 | 2.3 |
| 198087 | 14000453 | Tributary to Nanika River | Cutthroat 1 | Barrier | Low | 1.90 | low | SS-CBS | 1200 | 3.96 | 3.3 | 3.1 |
| 197994 | 14000481 | Tributary to Gosnell Creek | 6 Road | Barrier | Medium | 1.10 | mod | SS-CBS | 40 | 0.94 | 23.5 | 12.9 |
| 197991 | 14000506 | Tributary to Gosnell Creek | 6 Road | Barrier | Medium | 0.80 | mod | SS-CBS | 40 | 0.00 | 0.0 | 0.0 |
| 197998 | 14000507 | Tributary to Gosnell Creek | 6 Road | Barrier | Medium | 1.80 | mod | SS-CBS | 40 | 1.15 | 28.8 | 25.9 |
| 198009 | 14000535 | Tributary to Nanika River | 1 Road | Barrier | Low | 1.00 | low | SS-CBS | 40 | 0.49 | 12.2 | 6.1 |
| 197937 | 14000536 | Tributary to Nanika River | Spur | Barrier | Low | 0.80 | low | SS-CBS | 40 | 1.49 | 37.2 | 14.9 |
| 198016 | 14000562 | Tributary to Thautil River | Chisholm FSR | Barrier | Medium | 1.30 | mod | SS-CBS | 40 | 0.74 | 18.5 | 12.0 |
| 198003 | 14000582 | Tributary to Nanika River | Nanika FSR | Barrier | Low | 0.50 | low | SS-CBS | 40 | 1.14 | 28.5 | 7.1 |
| 198081 | 14000592 | Tributary to Lamprey Creek | 07 Road | Barrier | Low | 1.60 | low | SS-CBS | 40 | 3.65 | 91.2 | 73.0 |
| 198019 | 14000669 | Tributary to Thautil River | Chisholm FSR | Barrier | Medium | 1.60 | mod | SS-CBS | 40 | 5.40 | 135.0 | 108.0 |
| 198028 | 14000683 | Tributary to Thautil River | Chisholm FSR | Barrier | Low | 1.10 | low | SS-CBS | 40 | 5.12 | 128.0 | 70.4 |
| 197945 | 14000684 | Tributary to Thaulit River | Chisholm FSR | Barrier | Low | 1.00 | low | SS-CBS | 40 | 2.34 | 58.5 | 29.2 |
| 198020 | 14000688 | Tributary to Thautil River | Chisholm FSR | Barrier | Low | 0.00 | low | SS-CBS | 40 | 5.70 | 142.5 | 0.0 |
| 197952 | 14000690 | Tributary to Morice River | Chisholm FSR | Barrier | Low | 2.10 | low | OBS | 200 | 6.19 | 31.0 | 32.5 |
| 198029 | 14000694 | Tributary to Thautil River | Chisholm FSR | Barrier | Low | 0.90 | low | SS-CBS | 40 | 4.94 | 123.5 | 55.6 |
| 197944 | 14000695 | Tributary to Thaulit River | Chisholm FSR | Barrier | Medium | 2.20 | mod | OBS | 200 | 0.00 | 0.0 | 0.0 |
| 197954 | 14000696 | Tributary to Morice River | Chisholm FSR | Barrier | Medium | 1.70 | mod | OBS | 200 | 7.86 | 39.3 | 33.4 |
| 198026 | 14000697 | Tributary to Thautil River | Chisholm FSR | Barrier | Low | 0.70 | low | SS-CBS | 40 | 1.97 | 49.2 | 17.2 |
| 198060 | 14000718 | Tributary to Owen Creek | Morice-Owen FSR | Potential | Medium | 2.00 | low | OBS | 200 | 7.01 | 35.0 | 35.0 |
| 197962 | 14000798 | Peacock Creek | Morice FSR | Barrier | High | 9.30 | high | OBS | 316 | 6.14 | 19.4 | 90.4 |
| 198085 | 14000799 | Tributary to Lamprey Creek | Morice FSR | Barrier | Medium | 1.40 | mod | SS-CBS | 40 | 0.68 | 17.0 | 11.9 |
| 197989 | 14000801 | Tributary to Morice River | Morice FSR | Barrier | Medium | 2.20 | mod | OBS | 200 | 2.68 | 13.4 | 14.7 |
| 198067 | 14000804 | Tributary to Lamprey Creek | Morice R FSR | Barrier | Low | 2.20 | low | OBS | 200 | 6.77 | 33.9 | 37.2 |
| 198068 | 14000815 | Tributary to Lamprey Creek | Morice R FSR | Barrier | Low | 0.80 | low | SS-CBS | 40 | 1.03 | 25.8 | 10.3 |
| 197965 | 14000820 | Tributary to Collins Lake | Morice R FSR | Barrier | Medium | 0.35 | mod | SS-CBS | 40 | 7.77 | 194.2 | 34.0 |
| 198030 | 14000823 | Tributary to Lamprey Creek | Morice FSR | Barrier | Low | 1.00 | low | SS-CBS | 40 | 0.90 | 22.5 | 11.2 |
| 198008 | 14000865 | Tributary to Nanika River | Spur | Barrier | Medium | 1.80 | mod | SS-CBS | 40 | 0.60 | 15.0 | 13.5 |
| 198040 | 14000882 | Tributary to Morice River | Spur | Potential | Medium | 0.90 | low | SS-CBS | 40 | 0.34 | 8.5 | 3.8 |
| 198079 | 14000890 | Tributary to Lamprey Creek | Spur | Barrier | Medium | 0.90 | mod | SS-CBS | 40 | 1.23 | 30.8 | 13.8 |
| 198072 | 14000892 | Tributary to Lamprey Creek | Spur | Potential | Low | 1.00 | low | SS-CBS | 40 | 3.61 | 90.2 | 45.1 |
| 198080 | 14000894 | Tributary to Lamprey Creek | Spur | Barrier | Medium | 0.60 | mod | SS-CBS | 40 | 1.01 | 25.2 | 7.6 |
| 197931 | 14000932 | Tributary to Nanika River | Spur | Barrier | Low | 0.40 | low | SS-CBS | 40 | 1.19 | 29.8 | 6.0 |
| 197982 | 14000941 | Tributary to Gosnell Creek | Crystal Creek FSR | Barrier | Medium | 2.20 | mod | OBS | 200 | 5.75 | 28.8 | 31.6 |
| 197923 | 14000949 | Tributary to Gosnell Creek | Crystal Creek FSR | Barrier | Low | 0.90 | low | SS-CBS | 40 | 0.28 | 7.0 | 3.1 |
| 197924 | 14000954 | Tributary to Gosnell Creek | Crystal Creek FSR | Barrier | Low | 1.30 | low | SS-CBS | 40 | 1.46 | 36.5 | 23.7 |
| 198084 | 14000968 | Tributary to Lamprey Creek | Spur | Barrier | Medium | 0.90 | mod | SS-CBS | 40 | 1.48 | 37.0 | 16.6 |
| 198062 | 14000991 | Tributary to Morice River | Morice-West FSR | Barrier | Medium | 10.00 | mod | OBS | 300 | 2.61 | 8.7 | 43.5 |
| 198034 | 14000994 | Tributary to Thautil River | Thautil FSR | Barrier | Medium | 0.60 | mod | SS-CBS | 40 | 3.15 | 78.8 | 23.6 |
| 197928 | 14000997 | Tributary to Morice River | Morice West FSR | Barrier | Low | 1.20 | low | SS-CBS | 40 | 0.63 | 15.8 | 9.4 |
| 197926 | 14001002 | Tributary to Morice River | Morice West FSR | Barrier | Medium | 2.00 | mod | OBS | 200 | 8.98 | 44.9 | 44.9 |
| 198002 | 14001009 | Tributary to Nanika River | 9 Road | Barrier | Low | 0.50 | low | SS-CBS | 40 | 1.37 | 34.2 | 8.6 |
| 198082 | 14001062 | Tributary to Lamprey Creek | Bill Nye | Barrier | Medium | 0.60 | mod | SS-CBS | 40 | 1.81 | 45.2 | 13.6 |
| 198007 | 14001077 | Tributary to Nanika River | Spur | Barrier | Low | 1.00 | low | SS-CBS | 40 | 2.13 | 53.2 | 26.6 |
| 198005 | 14001078 | Tributary to Nanika River | Spur | Barrier | Low | 0.80 | low | SS-CBS | 40 | 2.09 | 52.2 | 20.9 |
| 198064 | 14001094 | Tributary to Lamprey Creek | Spur | Barrier | Medium | 2.56 | mod | OBS | 200 | 5.05 | 25.2 | 32.3 |
| 198000 | 14001161 | McBride Creek | Nanika FSR | Potential | High | 9.00 | mod | OBS | 280 | 84.07 | 300.2 | 1351.1 |
| 198086 | 14001170 | Tributary to Lamprey Creek | spur (overgrown) | Barrier | Low | 2.00 | low | OBS | 200 | 6.12 | 30.6 | 30.6 |
| 197951 | 14001177 | Tributatry to Morice River | False Tagit FSR | Barrier | Medium | 3.00 | mod | OBS | 200 | 11.06 | 55.3 | 83.0 |
| 198051 | 14001409 | Tributary to Thautil River | Spur | Barrier | Low | 1.30 | low | SS-CBS | 40 | 2.07 | 51.8 | 33.6 |
| 197934 | 14001414 | Tributary to Nanika River | Spur | Potential | Low | 1.00 | low | SS-CBS | 40 | 3.10 | 77.5 | 38.8 |
| 198052 | 14001468 | Tributary to Thautil River | Spur | Barrier | Low | 0.50 | low | SS-CBS | 80 | 1.60 | 20.0 | 5.0 |
| 198075 | 14001624 | Tributary to Collins Lake | Spur | Potential | Low | 0.65 | low | SS-CBS | 40 | 0.70 | 17.5 | 5.7 |
| 198022 | 14001769 | Tributary to Tagit Creek | 5 Road | Barrier | Medium | 1.40 | mod | SS-CBS | 40 | 6.67 | 166.8 | 116.7 |
| 197960 | 24704566 | Corya Creek | Railway | Barrier | High | 18.00 | high | OBS | 1800 | 27.01 | 15.0 | 135.1 |
| 197938 | 2021083150 | Bulkley River Side Channel | Railway | Potential | Medium | 3.00 | low | SS-CBS | 1200 | 1.01 | 0.8 | 1.3 |
| 197992 | 2021090161 | Tributary to Gosnell Creek | 6 Road | Barrier | Low | 0.50 | low | SS-CBS | 40 | – | – | – |
| 197936 | 2021090299 | – | Spur | Barrier | Low | 0.90 | low | SS-CBS | 40 | 1.62 | 40.5 | 18.2 |
| 197949 | 2021090303 | Tributary to Tagit Creek | 11 Rd | Barrier | Medium | 2.00 | mod | OBS | 200 | 6.16 | 30.8 | 30.8 |
| 198090 | 2021090551 | Cesford Creek | Railway | Barrier | High | 5.00 | high | OBS | 200 | 0.00 | 0.0 | 0.0 |
4.2 Bulkley Falls Assessment
Bulkley Falls is located near Topley, BC on the mainstem of the Bulkley River. Information on the crossing was scarce so an assessment was prioritized by Canadian Wildlife Federation. The site was assessed on October 28, 2021 by Nallas Nikal, B.i.T, and Chad Lewis, Environmental Technician. The top of the falls is located at 11U.678269.6038266 at an elevation of 697m approximatley 11.3km downstream of Bulkley Lake and upstream of Ailport Creek (Figures 4.2 - 4.3).. Water temperature was 3.0\(^\circ\)C, pH was 7.75 and conductivity was 159uS/cm. Within the Bulkley River immediately below the 12 - 15m high bedrock falls, channel width was 17.4m and the wetted width was 15.6m. Two channels comprised the falls. The primary channel was 20m long, had a channel/wetted width of 8.5m, a 16% grade and water depths ranging from 35 - 63cm. The secondary channel was 25m long, with channel/wetted widths of 7.5m, a grade of 12% and water depths ranging from 3 - 13cm.
Dyson (1949) and Stokes (1956) report substantial use of habitat above Bulkley Falls by steelhead, chinook, coho and sockeye utilization in the past (pre-1950) based on spawning reports. Both authors concluded that the Bulkley Falls pose a partial obstruction to migrating fish based on flow levels. Chinook, which migrate early in the summer when water levels are high, have been noted as able to ascend the falls in normal to high water years and in high water years it was thought that coho and steelhead could ascend. A. Gottesfeld and Rabnett (2007) report that the falls are almost completely impassable to all salmon during low water flows. Stokes (1956) reports that there was high value spawning habitat located within the first 3km of the Bulkley River from the outlet of Bulkley Lake.
my_photo1 = fpr::fpr_photo_pull_by_str(site = 'bulkley_falls', str_to_pull = '_u1_')

my_caption1 = paste0('Bulkley Falls main channel.')


# fpr::fpr_photo_flip(site_id = 1802488, str_to_pull = '6257')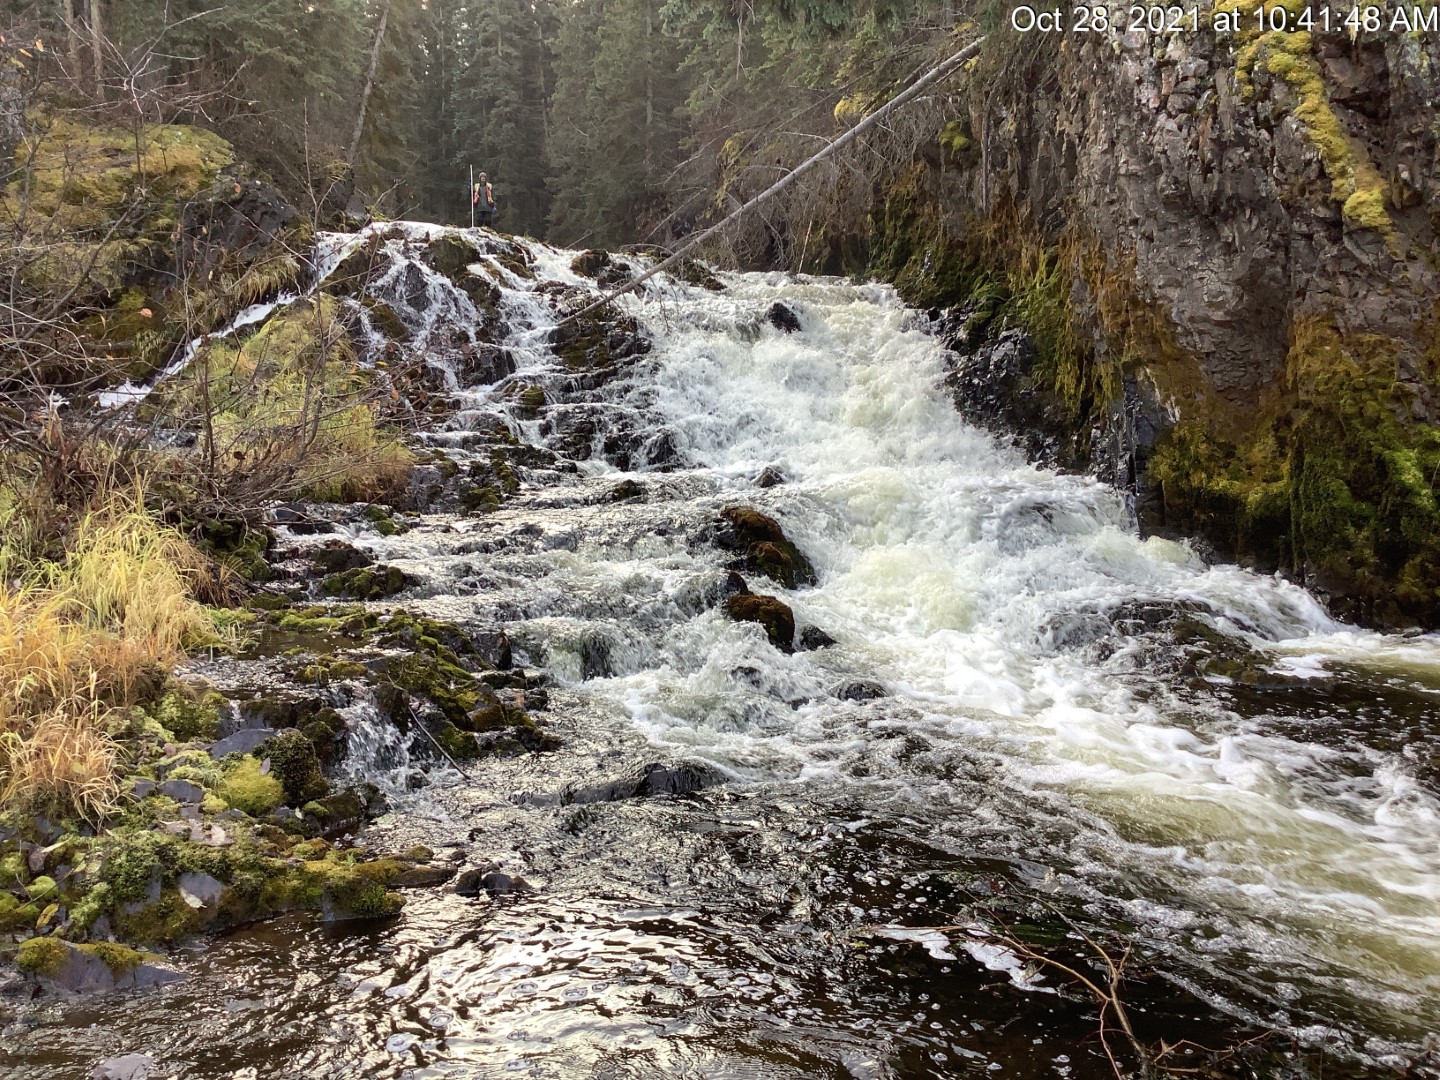
Figure 4.2: Bulkley Falls main channel.
my_photo2 = fpr::fpr_photo_pull_by_str(site = 'bulkley_falls', str_to_pull = '_u2_')

my_caption2 = paste0('Bulkley Falls side channel.')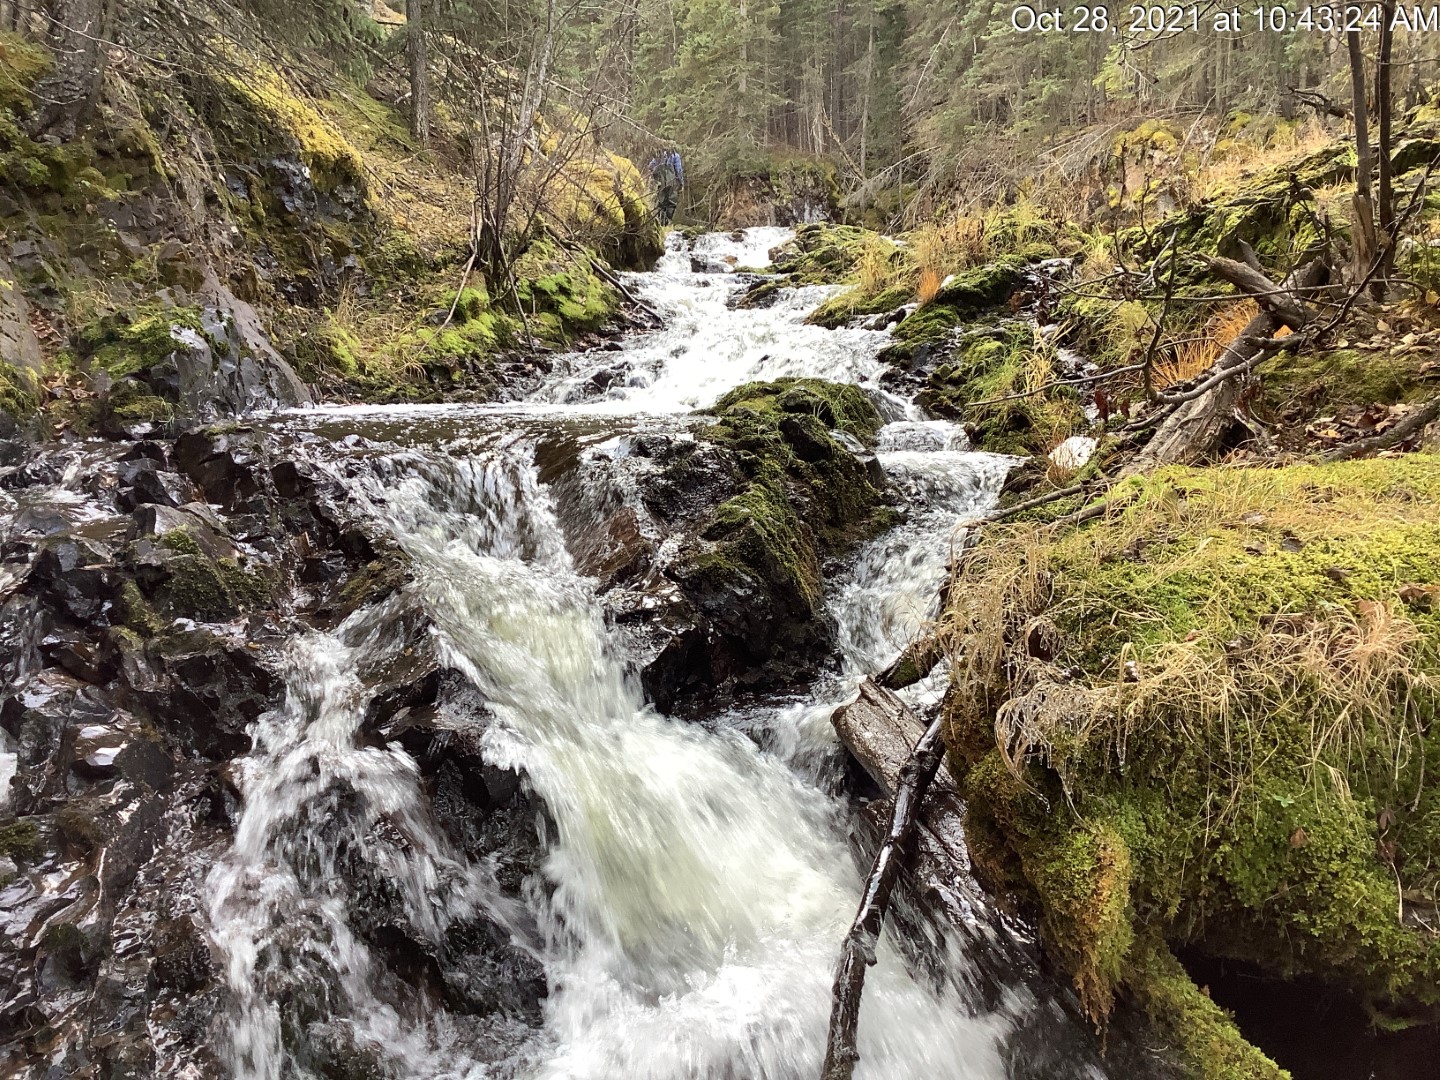
Figure 4.3: Bulkley Falls side channel.
4.3 Phase 2
During 2021 field assessments, habitat confirmation assessments were conducted at 29 sites in the Bulkley River and Morice River watershed groups. A total of approximately 25km of stream was assessed, fish sampling utilizing electrofishing was conducted at five sites, and five sites were mapped using remotely piloted aircraft. Georeferenced field maps are presented in here and available for bulk download as Attachment 1.
As collaborative decision making was ongoing at the time of reporting, site prioritization can be considered preliminary. In total, Twelve crossings were rated as high priorities for proceeding to design for replacement, 11 crossings were rated as moderate priorities, and 6 crossings were rated as low priorities. Results are summarized in Figure 4.1 and Tables 4.2 - 4.6 with raw habitat and fish sampling data included in digital format as Attachment 3. A summary of preliminary modelling results illustrating the quantity of chinook, coho and steelhead spawning and rearing habitat potentially available upstream of each crossing as estimated by measured/modelled channel width and upstream accessible stream length are presented in Figure 4.4. Detailed information for each site assessed with Phase 2 assessments (including maps) are presented within site specific appendices to this document.
#`r if(gitbook_on){knitr::asis_output("<br>")} else knitr::asis_output("<br><br><br><br><br><br><br><br><br><br><br><br><br><br><br><br><br><br><br><br><br><br><br><br><br><br><br><br><br><br><br>")`
# if(gitbook_on){
# tab_overview %>%
#   select(-Tenure) %>%
#   fpr::fpr_kable(caption_text = 'Overview of habitat confirmation sites.')
# } else tab_overview %>%
#   select(-Tenure) %>%
#   fpr::fpr_kable(caption_text = 'Overview of habitat confirmation sites.', scroll = F)

tab_overview %>%
  select(-Tenure) %>%
table_phase2_overview(caption_text = 'Overview of habitat confirmation sites. Default value for habitat estimates is from coho rearing model (total length of stream segments <5.5% gradient) however please see comments for exceptions.', scroll = gitbook_on)| PSCIS ID | Stream | Road | UTM (11U) | Fish Species | Habitat Gain (km) | Habitat Value | Priority | Comments |
|---|---|---|---|---|---|---|---|---|
| 57944 | Toboggan Creek | Highway 16 | 607729 6089383 | CC,CH,CO,CT,DV,KO,L,LSU,MW,OS,PK,RB,SK,ST | 52.4 | High | high | Water quite turbid due to rain event. Armoured banks due to adjacent properties. Not very complex in area surveyed from highway up. Hatchery located upstream. Extremely high value spawning and rearing habitat upstream of Owen Creek bridge with spawning salmon noted throughout. |
| 58151 | McDowell Creek | Woodmere Road | 629753 6061126 | RB | 4.3 | Medium | low | Channel dry. Close to house so very short dry survey. Lots of fines and sediment likely from cleared yard, roads, and agriculture use. Channel well defined. |
| 123375 | Tributary to Thompson Creek | Highway 16 | 642497 6048191 | – | 0.0 | Low | low | Mapped incorrectly as Thompson Ck mainstem in freshwater atlas. Main flow actually to north and flows under highway at PSCIS 123375. Heavily impacted by cattle. Fine substrates, low flow, very small stream. Unlikley fish bearing. |
| 123377 | Thompson Creek | Walcott Road | 641633 6049398 | CT,DV,RB | 12.3 | High | high | High value habitat, frequent deep pools to 80cm and abundant large woody debris and gravels. Narrow but meaningful mature cottonwoood riparian. Majority of flow comes from open bottom structure under highway (PSCIS 123376) vs channel mapped as mainstem. |
| 123544 | McDowell Creek | Private Road | 628287 6060648 | RB | 6.1 | Medium | low | Dry at time of survey. Culvert inlet is perched aprox. 5m above channel. Road appears to be historic pipeline or powerline. Creates impassably steep gradients immediately downstream of crossing due to fill placement. |
| 123770 | John Brown Creek | Highway 16 | 606627 6097185 | BT,CH,CT,DV,RB | 11.7 | Medium | high | Frequent sections of gravels suitable for spawning salmon. Occasional very deep pools formed by large woody debris. Large eroding bank near mill. Mealthy mature mixed riparian vegetation. Six electrofishing sites. |
| 123775 | Witset Creek | Highway 16 | 606445 6099726 | – | – | Low | low | No flow. Beaver activity present. Stream channel overgrown. Witset Lake outflow disconnected from stream. Witset mainenance actively traps beavers to prevent flood events as of 2017. |
| 124420 | Station Creek | Highway 16 | 586632 6122395 | BT,CO,CT,DV,PK,RB,SP | 9.3 | Medium | high | Frequent pockets of gravels suitable for spawning throughout. High value spawning habitat in upper end of survey area. Refer to DFO report for habitat details. |
| 124421 | Tributary to Waterfall Creek | 11th Ave | 589467 6123042 | CO,DV | 1.3 | Medium | moderate | Slow moving wetland type stream. Deep glides throughout with instream vegetation, overhanging vegetation, and undercut banks. Near top of survey, gradient increased slightly and substrate goes from fines/organics to small gravel. |
| 124422 | Tributary to Waterfall Creek | Highway 16 | 589500 6123162 | CO,DV | 1.2 | Medium | low | Appears to be restoration site with logs embedded in stream and gravels added. Upstream of footbridge stream flows from wetland type habitat. Low priority as 100% backwatered and likely passable for parr and adult salmon. |
| 197370 | Owen Creek | Morice West FSR | 639980 6008557 | – | 1.9 | High | high | Aerial survey conducted. Wetland and glide type habitat. Bii Wenii C’eek historic fishing site located near confluence of this stream and Morice River. Office of Wet’suwet’en contact (Mike Risdale) reports that this stream historically carrier flows from mainstem of Owen Creek which has now been redirected to Morice River at bridge site upstream. Mesohabitat mapping conducted in this area in the fall of 2021 by Jeff Anderson. |
| 197378 | Tributary to Owen Creek | Klate Lake | 645085 5998822 | DV,LNC,MW,RB | 0.6 | Medium | moderate | Small stream with multiple beaver influenced wetland areas with dams.Surveyed upstream on two branches to location of wetland areas. Several pockets of gravel suitable for resident rainbow spawning. Good flow with run habitat. |
| 197379 | Tributary to Owen Creek | Morice-Owen FSR | 640961 6005930 | CO,RB | 0.1 | High | high | Abundant undercut banks with some pools. Healthy riparian vegetation providing cover and woody debris to habitat. Good flow. |
| 197662 | Richfield Creek | Highway 16 | 672405 6044146 | CH,CO,LKC,LNC,LSU,RB,ST | 32.8 | High | high | Three closed multipass electrofishing sites upstream and downstream. Habitat confirmation conducted in 2020 with results in 2021 report. Mesohabitat mapping conducted with Office of Wet’suwet’en field crew and Jeff Anderson in 2021. |
| 197909 | Tributary to Maxan Creek | Maxan Creek FSR | 687557 6020572 | – | 0.2 | Medium | low | Small stream with beaver pond upstream. Downstream channel confined. |
| 197912 | Robert Hatch Creek | Private | 670963 6046221 | LSU,RB | 27.7 | – | moderate | High value habitat. Abundant gravels, deep pools, undercut banks, and small woody debris. Areas of algal growth. Cattle impacts extreme throughout. |
| 197960 | Corya Creek | CN Railway | 605786 6099884 | DV,RB | 10.0 | High | high | High energy glaciated system. Substrate quite embedded. Three electrofishing sites upstream and three sites downstream. |
| 197962 | Peacock Creek | Morice FSR | 643460 6025890 | – | 4.8 | Medium | high | Culvert has been replaced with a bridge. Complex habitat with undercut banks, large and small woody debris and some nice pools. Three closed site multi-pass electrofishing sites upstream and three downstream. |
| 197967 | Taman Creek | Highway 16 | 692435 6032331 | BMC,CSU,LKC,LNC,LSU,NSC,RB,RSC | 51.9 | Medium | moderate | First 250m above crossing was beaver influenced area with dry channel. Frequent pockets of gravels and small cobbles suitable for rainbow trout and coho salmon spawning further upstream. Canyon section has deep bedrock pools with small fish present. |
| 197975 | Ailport Creek | Private Driveway | 680832 6040045 | CO,CT,RB | 24.7 | Medium | high | Cattle and dredgeing damage in first sections of survey with dredges in first 80m removing all habitat. Heavy grazing continuous for another few hundred meters. Deep pools, undercut banks, and overhanging vegetation occurs throughout. Fence across stream halfway up. Some areas have large piles of substrate deposited within extent of channel (perhaps from flooding). Two electrofishing sites upstream and two sites downstream. |
| 197976 | Ailport Creek | Highway 16 | 680645 6039756 | CO,CT,RB | 25.1 | High | moderate | Fish sighted throughout. Extensive algae growth seen during entire survey. Fences accrosss creek near highway including electric fence. Riparian / bank damage from livestock quite minimal and only seen in a few places as trails, perhaps watering sites. 150mm long fish observed swimming upstream through culvert during survey. |
| 198000 | McBride Creek | Nanika FSR | 605511 5992667 | BB,CAS,CO,CSU,CT,DV,LDC,LSU,LT,LW,MW,PCC,RB,RSC,WSU | 20.1 | High | moderate | Abundant instream vegetation including vascular plants. Large woody debris accumulated at outflow of McBride Lake. |
| 198008 | Tributary to Nanika River | Spur | 606426 5986782 | – | 0.0 | Medium | moderate | Multiple channels. Surveyed non-dominant channel. Site should be reassessed to confirm habitat upstream of 100m. Bottom 100m before split is low gradient gravels with good flow for time of year. |
| 198016 | Tributary to Thautil River | Chisholm FSR | 608138 6020911 | SP | 1.2 | Medium | moderate | Fish sighted in stream (unknown species). Sporadic pools and abundant deeply undercut banks. Abundant gravels present suitable for spawning. Very occasional large and small woody debris steps to 70cm. Good flow with mature spruce riparian.Site is pinned to wrong stream in PSCIS as actual stream is just south of where coordinate is and is on larger system. Location has been corrected in bcfishpass. Although not modelled as salmon/steelhead habitat, upstream habitat likely suitable for non-anadromous species estimated by hand in QGIS at 1200m and is habitat modelling as less than 12% gradient and within south fork of stream only. Sampling recomended. |
| 198048 | Cesford Creek | Highway 16 | 674397 6043433 | – | 10.7 | High | moderate | Stream appears to have been dredged for near entire length between highways. Left side of stream is powerline and highway for first 200m. Riparian area is very sparse below due to agricultural land clearing. Fish are concentrated in pool habitat which is sporatic. Frequent pockets of gravel throughout. Good flow. Eroded bank at near highway 118. |
| 198049 | Cesford Creek | Highway 118 | 674875 6043782 | – | 10.0 | High | moderate | Good flow and decent complexity due to mature cottonwood riparian / large woody debris. Occossional pools and frequent gravel sections. |
| 198064 | Tributary to Lamprey Creek | Spur | 623369 6000283 | DV | 1.8 | Medium | moderate | Comparitively good flow for a smaller tributary in the greater Lamprey Creek watershed. Abundant gravel suitable for coho spawning at higher flows. Abundant undercut banks for cover but pools observed as shallow. Upstream habitat estimated from QGIS and is mainstem habitat less than 9% gradient and mostly confirmed DV habitat. |
| 198066 | Thompson Creek | Private Road | 640244 6048061 | CO,CRS,CT,DV,RB,SP | 14.7 | High | high | Important migration corridor. Fully channelized through agricultural area. Fine sediments, pool and glide habitat up to 80 cm deep. Canary reed grass riparian. Landowner reports stream was redirected in 60s and used to flow from the valley to the Bulkley in a low lying area in a north west direction. |
| 198090 | Cesford Creek | CN Railway | 673235 6043218 | RB | 11.7 | High | high | No connection to Bulkley River under railway found and landowner reports there is not one present. Large ditch runs north-south and may be impacting water level in oxbow type habitat comprising lower end of stream. Primarily dry to just before Highway 16. Important migration corridor. Coho would likely be present upstream if connected to the Bulkley River. |
fpr::fpr_table_cv_summary(dat = pscis_phase2) %>%
fpr::fpr_kable(caption_text = 'Summary of Phase 2 fish passage reassessments.', scroll = gitbook_on)| PSCIS ID | Embedded | Outlet Drop (m) | Diameter (m) | SWR | Slope (%) | Length (m) | Final score | Barrier Result |
|---|---|---|---|---|---|---|---|---|
| 57944 | No | 0.00 | 7.00 | 1.2 | 3.0 | 30 | 29 | Barrier |
| 58151 | No | 0.25 | 1.00 | 1.8 | 5.0 | 14 | 31 | Barrier |
| 123375 | No | 0.00 | 0.50 | 2.0 | 2.0 | 29 | 24 | Barrier |
| 123377 | No | 0.25 | 1.05 | 4.6 | 3.0 | 29 | 34 | Barrier |
| 123544 | No | 0.00 | 1.50 | 1.8 | 18.5 | 14 | 26 | Barrier |
| 123770 | No | 0.64 | 4.00 | 3.1 | 2.0 | 36 | 37 | Barrier |
| 123775 | No | 0.00 | 1.22 | 0.4 | 0.5 | 32 | 16 | Potential |
| 124420 | No | 0.80 | 1.60 | 3.5 | 3.5 | 90 | 42 | Barrier |
| 124421 | No | 0.30 | 1.00 | 2.6 | 1.0 | 15 | 34 | Barrier |
| 124422 | No | 0.00 | 1.20 | 4.3 | 1.5 | 45 | 27 | Barrier |
| 197370 | No | 0.00 | 0.90 | 7.6 | 1.0 | 18 | 24 | Barrier |
| 197378 | No | 0.10 | 1.00 | 2.4 | 1.0 | 15 | 24 | Barrier |
| 197379 | No | 0.47 | 1.50 | 4.3 | 1.5 | 26 | 34 | Barrier |
| 197662 | No | 0.20 | 4.20 | 3.0 | 2.0 | 24 | 29 | Barrier |
| 197909 | No | 0.00 | 0.60 | 1.5 | 3.0 | 16 | 29 | Barrier |
| 197912 | – | – | 12.00 | 0.0 | – | 7 | 0 | Passable |
| 197960 | No | 0.65 | 3.40 | 5.3 | 2.5 | 24 | 34 | Barrier |
| 197962 | No | 0.50 | 3.60 | 2.6 | 3.5 | 15 | 39 | Barrier |
| 197967 | No | 0.00 | 3.00 | 1.8 | 2.5 | 30 | 27 | Barrier |
| 197975 | No | 0.30 | 3.00 | 2.2 | 4.0 | 10 | 36 | Barrier |
| 197976 | No | – | 3.50 | 2.1 | 2.0 | 23 | 24 | Barrier |
| 198000 | No | 0.05 | 3.90 | 2.3 | 0.5 | 16 | 19 | Potential |
| 198008 | No | 0.18 | 0.90 | 2.0 | 6.0 | 11 | 31 | Barrier |
| 198016 | No | 0.19 | 1.20 | 1.1 | 5.0 | 25 | 31 | Barrier |
| 198048 | No | 0.00 | 2.50 | 2.2 | 1.5 | 25 | 24 | Barrier |
| 198049 | No | 0.50 | 3.70 | 1.3 | 1.5 | 21 | 34 | Barrier |
| 198064 | No | 0.54 | 1.60 | 1.6 | 5.0 | 14 | 36 | Barrier |
| 198066 | No | 0.00 | 1.30 | 2.1 | 0.4 | 6 | 16 | Potential |
| 198090 | No | 0.00 | 0.10 | 50.0 | 3.0 | 15 | 29 | Barrier |
tab_cost_est_phase2_report %>%
  fpr::fpr_kable(caption_text = 'Cost benefit analysis for Phase 2 assessments. Default value for habitat estimates is from coho rearing model (total length of stream segments <5.5% gradient) however please see comments for exceptions.)',
scroll = gitbook_on)| PSCIS ID | Stream | Road | Result | Habitat value | Stream Width (m) | Fix | Cost Est (in $K) | Habitat Upstream (m) | Cost Benefit (m / $K) | Cost Benefit (m2 / $K) |
|---|---|---|---|---|---|---|---|---|---|---|
| 57944 | Toboggan Creek | Highway 16 | Barrier | High | 8.5 | OBS | 8100 | 52355 | 6.5 | 54.9 |
| 58151 | McDowell Creek | Woodmere Road | Barrier | Medium | 1.7 | SS-CBS | 160 | 4300 | 26.9 | 45.7 |
| 123377 | Thompson Creek | Walcott Road | Barrier | High | 4.8 | OBS | 1600 | 12315 | 7.7 | 36.9 |
| 123544 | McDowell Creek | Private Road | Barrier | Medium | – | OBS | 200 | 6070 | 30.4 | – |
| 123770 | John Brown | Highway 16 | Barrier | Medium | 12.2 | OBS | 11400 | 11710 | 1.0 | 12.5 |
| 123775 | Witset Creek | Highway 16 | Potential | Low | 2.4 | SS-CBS | 1200 | – | – | – |
| 124420 | Mission Creek | Highway 16 | Barrier | Medium | 5.7 | OBS | 18000 | 9255 | 0.5 | 2.9 |
| 124421 | Tributary to Waterfall Creek | 11th Ave | Barrier | Medium | 2.6 | OBS | 800 | 1340 | 1.7 | 4.4 |
| 124422 | Tributary to Waterfall Creek | Highway 16 | Barrier | Medium | 6.7 | OBS | 11400 | 1210 | 0.1 | 0.7 |
| 197370 | Owen Creek | Morice West FSR | Barrier | High | – | OBS | 240 | 1870 | 7.8 | – |
| 197378 | Tributary to Owen Creek | Klate Lake | Barrier | Medium | 1.8 | OBS | 200 | 560 | 2.8 | 5.0 |
| 197379 | Tributary to Owen Creek | Morice-Owen FSR | Barrier | High | 6.4 | OBS | 320 | 120 | 0.4 | 2.4 |
| 197662 | Richfield Creek | Highway 16 | Barrier | High | 13.2 | OBS | 9900 | 32780 | 3.3 | 43.7 |
| 197909 | Tributary to Maxan Creek | Maxan Creek FSR | Barrier | Medium | 1.3 | SS-CBS | 40 | 225 | 5.6 | 7.3 |
| 197912 | Robert Hatch Creek | Private | Passable | – | 4.3 | – | 30 | 27720 | 924.0 | 3973.2 |
| 197960 | Corya Creek | Railway | Barrier | High | 18.0 | OBS | 13800 | 9960 | 0.7 | 13.0 |
| 197962 | Peacock Creek | Morice FSR | Barrier | Medium | 6.9 | OBS | 320 | 4810 | 15.0 | 103.7 |
| 197967 | Taman Creek | Highway 16 | Barrier | Medium | 5.3 | OBS | 18600 | 51905 | 2.8 | 14.8 |
| 197975 | Ailport Creek | Private Driveway | Barrier | Medium | 7.7 | OBS | 230 | 24690 | 107.3 | 826.6 |
| 197976 | Ailport Creek | Highway 16 | Barrier | High | 8.1 | OBS | 7500 | 25090 | 3.3 | 27.1 |
| 198000 | McBride Creek | Nanika FSR | Potential | High | 5.5 | OBS | 280 | 20095 | 71.8 | 394.7 |
| 198008 | Tributary to Nanika River | Spur | Barrier | Medium | 2.0 | SS-CBS | 40 | 0 | 0.0 | 0.0 |
| 198016 | Tributary to Thautil River | Chisholm FSR | Barrier | Medium | 1.9 | SS-CBS | 40 | 1200 | 30.0 | 57.0 |
| 198048 | Cesford Creek | Highway 16 | Barrier | High | 5.1 | OBS | 6000 | 10700 | 1.8 | 9.1 |
| 198049 | Cesford Creek | Highway 118 | Barrier | High | 5.0 | OBS | 6000 | 10030 | 1.7 | 8.4 |
| 198064 | Tributary to Lamprey Creek | Spur | Barrier | Medium | 2.8 | OBS | 200 | 1800 | 9.0 | 25.2 |
| 198066 | Thompson Creek | Private Road | Potential | High | 2.8 | OBS | 200 | 14705 | 73.5 | 205.9 |
| 198090 | Cesford Creek | Railway | Barrier | High | – | OBS | 200 | 11700 | 58.5 | – |
tab_hab_summary %>%
  filter(Location %ilike% 'upstream') %>%
  select(-Location) %>%
  rename(`PSCIS ID` = Site, `Length surveyed upstream (m)` = `Length Surveyed (m)`) %>%
fpr::fpr_kable(caption_text = 'Summary of Phase 2 habitat confirmation details.', scroll = gitbook_on)| PSCIS ID | Length surveyed upstream (m) | Channel Width (m) | Wetted Width (m) | Pool Depth (m) | Gradient (%) | Total Cover | Habitat Value |
|---|---|---|---|---|---|---|---|
| 57944 | 880 | 8.5 | 6.7 | 0.5 | 2.1 | moderate | high |
| 57944 | 150 | 12.6 | 10.5 | 2.0 | 0.5 | abundant | high |
| 58151 | 70 | 1.7 | – | – | 0.8 | abundant | low |
| 123375 | 100 | 1.7 | 1.9 | – | 0.7 | – | low |
| 123377 | 450 | 4.8 | 3.4 | 0.7 | 2.7 | abundant | high |
| 123544 | 25 | – | – | – | – | – | low |
| 123770 | 1000 | 12.2 | 8.3 | 0.8 | 2.9 | moderate | high |
| 123770 | 350 | 11.2 | 9.1 | 0.3 | 3.0 | moderate | high |
| 123775 | 200 | 2.4 | 0.9 | – | 1.2 | moderate | low |
| 124420 | 370 | 5.7 | 4.7 | 0.5 | 2.0 | abundant | high |
| 124420 | 430 | 6.2 | 5.5 | – | 0.5 | abundant | high |
| 124421 | 120 | 2.6 | 2.5 | 0.3 | 1.0 | abundant | moderate |
| 124422 | 350 | 6.7 | 6.6 | – | 1.0 | abundant | moderate |
| 197370 | 1500 | – | – | – | – | – | high |
| 197378 | 665 | 1.8 | 1.5 | – | 3.0 | abundant | medium |
| 197379 | 800 | 6.4 | 3.1 | 0.7 | 4.8 | moderate | high |
| 197662 | 100 | 13.2 | – | – | 2.1 | – | high |
| 197909 | 100 | 1.3 | – | – | – | moderate | moderate |
| 197912 | 340 | 4.3 | 2.5 | 0.6 | 1.5 | abundant | high |
| 197960 | 1000 | 18.0 | 8.9 | 0.7 | 2.8 | moderate | medium |
| 197962 | 750 | 6.9 | 3.6 | 0.4 | 2.8 | moderate | high |
| 197967 | 800 | 5.3 | 2.3 | 0.7 | 1.7 | moderate | medium |
| 197967 | 400 | 3.8 | 2.2 | 0.5 | 1.5 | moderate | medium |
| 197975 | 550 | 7.7 | 3.5 | 0.3 | 3.0 | moderate | medium |
| 197976 | 345 | 8.1 | 4.2 | 0.3 | 2.2 | moderate | medium |
| 198000 | 135 | 5.5 | 4.4 | – | 1.0 | moderate | high |
| 198008 | 800 | 2.0 | 0.9 | 0.2 | 7.5 | abundant | medium |
| 198016 | 625 | 1.9 | 1.5 | 0.3 | 7.0 | moderate | medium |
| 198042 | – | 11.5 | 11.0 | – | 0.2 | moderate | – |
| 198048 | 675 | 5.1 | 3.3 | 0.3 | 2.8 | moderate | medium |
| 198049 | 600 | 5.0 | 2.8 | 0.5 | 2.1 | moderate | medium |
| 198049 | 500 | 4.3 | 1.9 | 0.5 | 4.2 | moderate | medium |
| 198064 | 500 | 2.8 | 1.9 | – | 4.2 | moderate | medium |
| 198066 | 350 | 2.8 | 2.1 | – | 0.5 | moderate | medium |
| 198066 | 450 | 5.2 | 2.8 | 0.4 | 2.5 | moderate | high |
| 198090 | – | – | – | – | – | – | moderate |
fpr::fpr_table_wshd_sum() %>%
  fpr::fpr_kable(caption_text = paste0('Summary of watershed area statistics upstream of Phase 2 crossings.'),
footnote_text = 'Elev P60 = Elevation at which 60% of the watershed area is above')| Site | Area Km | Elev Site | Elev Min | Elev Max | Elev Median | Elev P60 | Aspect |
|---|---|---|---|---|---|---|---|
| 57944 | 119.9 | 413 | 412 | 2586 | 629 | 547 | SE |
| 58151 | 15.9 | 610 | 576 | 1038 | 850 | 810 | SSW |
| 123377 | 43.1 | 613 | 596 | 1623 | 832 | 802 | WSW |
| 123544 | 15.9 | 553 | 576 | 1038 | 850 | 810 | SSW |
| 123770 | 80.6 | 385 | 375 | 2050 | 1201 | 1087 | SE |
| 123775 | 4.1 | 406 | 478 | 1248 | 762 | 697 | E |
| 124420 | 28.6 | 301 | 211 | 2171 | 521 | 425 | NNE |
| 124422 | 3.3 | 320 | 224 | 430 | 331 | 326 | SSW |
| 197370 | 3.9 | 650 | 644 | 953 | 739 | 717 | WSW |
| 197378 | 7.9 | 758 | 743 | 2073 | 920 | 885 | ENE |
| 197379 | 32.9 | 676 | 688 | 1418 | 931 | 909 | SSW |
| 197662 | 161.3 | 676 | 650 | 1753 | 1096 | 1039 | SSW |
| 197909 | 2.1 | 835 | 788 | 956 | 851 | 847 | E |
| 197912 | 31.5 | 720 | 715 | 1070 | 1004 | 983 | S |
| 197960 | 65.7 | 415 | 410 | 2502 | 1260 | 1106 | ESE |
| 197962 | 36.3 | 631 | 654 | 1822 | 1166 | 1119 | E |
| 197967 | 93.8 | 736 | 699 | 1373 | 900 | 870 | S |
| 197975 | 66.9 | 735 | 736 | 1445 | 1186 | 1093 | SSW |
| 197976 | 66.9 | 729 | 736 | 1445 | 1186 | 1093 | SSW |
| 198000 | 83.5 | 799 | – | 1597 | 908 | 887 | SSW |
| 198008 | 1.6 | 912 | – | 1605 | 1221 | 1150 | NW |
| 198048 | 36.6 | 679 | 659 | 1543 | 935 | 914 | SSW |
| 198049 | 34.0 | 698 | 675 | 1543 | 951 | 929 | SSW |
| 198064 | 4.8 | 740 | 763 | 1221 | 1061 | 967 | WSW |
| 198066 | 43.1 | 548 | 596 | 1623 | 832 | 802 | WSW |
| * Elev P60 = Elevation at which 60% of the watershed area is above |
bcfp_xref_plot <- xref_bcfishpass_names %>%
  filter(!is.na(id_join) &
           !bcfishpass %ilike% 'below' &
           !bcfishpass %ilike% 'all' &
           !bcfishpass %ilike% '_ha' &
           (bcfishpass %ilike% 'rearing' |
              bcfishpass %ilike% 'spawning'))

bcfishpass_phase2_plot_prep <- bcfishpass %>%
  mutate(across(where(is.numeric), round, 1)) %>%
    filter(stream_crossing_id %in% (pscis_phase2 %>% pull(pscis_crossing_id))) %>%
  select(stream_crossing_id, all_of(bcfp_xref_plot$bcfishpass)) %>%
  # filter(stream_crossing_id != 197665) %>%
  mutate(stream_crossing_id = as.factor(stream_crossing_id)) %>%
  pivot_longer(cols = ch_spawning_km:st_rearing_km)  %>%
  filter(value > 0.0 &
           !is.na(value)
         , !name %ilike% 'sk'
         ) %>%
  mutate(
    # name = stringr::str_replace_all(name, '_belowupstrbarriers_km', ''),
         name = stringr::str_replace_all(name, '_rearing', ' rearing'),
         name = stringr::str_replace_all(name, '_spawning', ' spawning'))
    # rename('Habitat type' = name,
    #        "Habitat (km)" = value)


 bcfishpass_phase2_plot_prep %>%
  ggplot(aes(x = stream_crossing_id, y = value)) +
  geom_bar(stat = "identity")+
  facet_wrap(~name, ncol = 2)+
  ggdark::dark_theme_bw(base_size = 11)+
   theme(axis.text.x=element_text(angle=90, hjust=1, vjust=0.5)) +
  labs(x = "Site", y = "Modelled habitat (km)")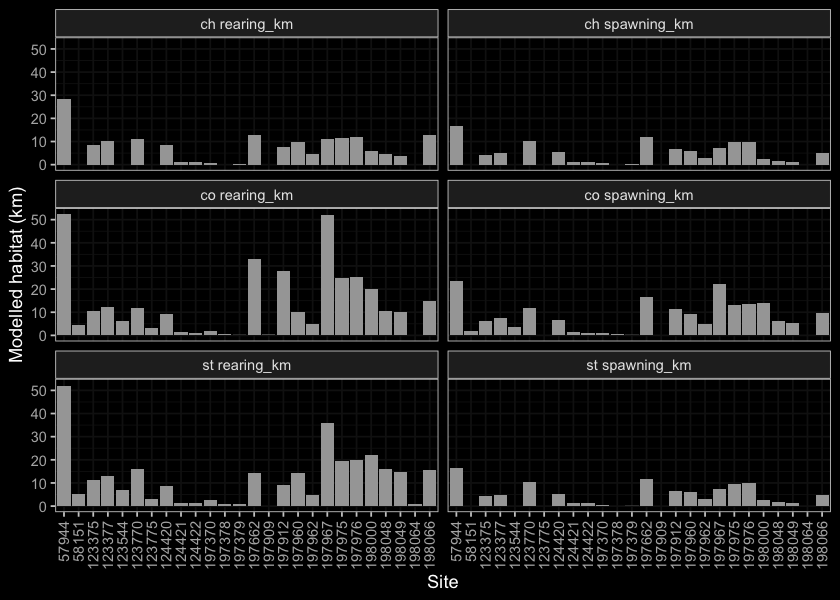
Figure 4.4: Summary of potential habitat upstream of habitat confirmation assessment sites estimated based on modelled channel width and upstream channel length.
4.3.1 Fish Sampling
Fish sampling was conducted at 31 sites with a total of 663 fish captured. Of these, 400 were rainbow trout, 147 coho, 69 were dolly varden and 19 were lamprey. Fork length data was used to delineate salmonids based on life stages: fry (0 to 65mm), parr (>65 to 110mm), juvenile (>110mm to 140mm) and adult (>140mm) by visually assessing the histograms presented in Figure 4.5. A summary of sites assessed are included in Table 4.7 and raw data is provided in Attachment 3. A summary of density results for all life stages combined of select species is also presented in Figure 4.6. Results are presented in greater detail within individual habitat confirmation site appendices.
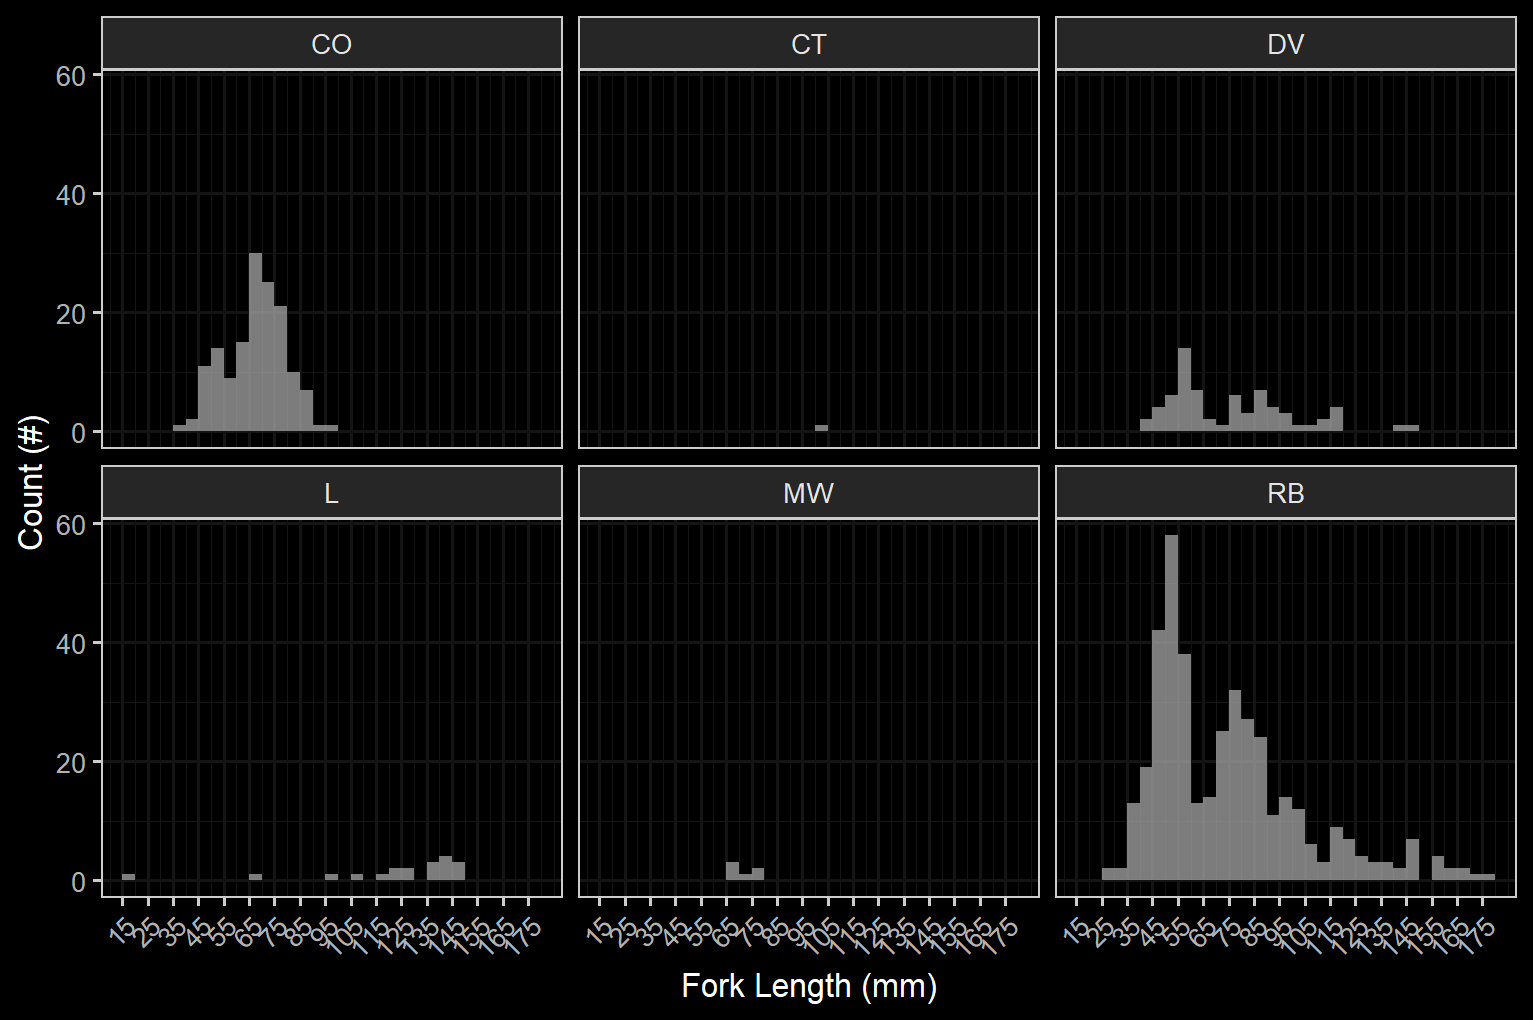
Figure 4.5: Histograms of fish lengths by species. Fish captured by electrofishing during habitat confirmation assessments.
| site | passes | ef_length_m | ef_width_m | area_m2 | enclosure |
|---|---|---|---|---|---|
| 123770_us_ef1 | 1 | 15.7 | 1.65 | 25.9 | Open |
| 123770_us_ef2 | 1 | 3.3 | 3.23 | 10.7 | Open |
| 123770_us_ef3 | 1 | 1.8 | 2.83 | 5.1 | Open |
| 123770_us_ef4 | 1 | 6.4 | 3.57 | 22.8 | Open |
| 123770_us_ef5 | 1 | 4.8 | 3.03 | 14.5 | Open |
| 123770_us_ef6 | 1 | 2.9 | 2.00 | 5.8 | Open |
| 197662_ds_ef1 | 6 | 21.4 | 6.10 | 130.5 | Closed |
| 197662_ds_ef2 | 4 | 5.8 | 5.60 | 32.5 | Closed |
| 197662_ds_ef3 | 3 | 4.2 | 6.05 | 25.4 | Closed |
| 197662_us_ef1 | 4 | 6.4 | 7.00 | 44.8 | Closed |
| 197662_us_ef2 | 3 | 5.1 | 4.83 | 24.6 | Closed |
| 197662_us_ef3 | 3 | 5.6 | 2.73 | 15.3 | Closed |
| 197912_ds_ef1 | 3 | 8.6 | 4.80 | 41.3 | Closed |
| 197912_ds_ef2 | 1 | 28.0 | 1.96 | 54.9 | Open |
| 197912_ds_ef3 | 1 | 14.0 | 2.87 | 40.2 | Open |
| 197960_ds_ef1 | 1 | 9.6 | 1.28 | 12.3 | Open |
| 197960_ds_ef2 | 1 | 5.0 | 1.83 | 9.2 | Open |
| 197960_ds_ef3 | 1 | 10.1 | 1.67 | 16.9 | Open |
| 197960_us_ef1 | 1 | 4.7 | 1.65 | 7.8 | Open |
| 197960_us_ef2 | 1 | 19.0 | 1.86 | 35.3 | Open |
| 197960_us_ef3 | 1 | 3.3 | 3.27 | 10.8 | Open |
| 197962_ds_ef1 | 3 | 14.2 | 4.83 | 68.6 | Closed |
| 197962_ds_ef2 | 3 | 6.8 | 4.63 | 31.5 | Closed |
| 197962_ds_ef3 | 3 | 7.1 | 2.90 | 20.6 | Closed |
| 197962_us_ef1 | 3 | 7.2 | 3.87 | 27.9 | Closed |
| 197962_us_ef2 | 3 | 5.7 | 4.97 | 28.3 | Closed |
| 197962_us_ef3 | 3 | 7.0 | 5.27 | 36.9 | Closed |
| 197975_ds_ef1 | 1 | 3.8 | 4.27 | 16.2 | Open |
| 197975_ds_ef2 | 1 | 3.9 | 3.60 | 14.0 | Open |
| 197975_us_ef1 | 1 | 6.0 | 3.30 | 19.8 | Open |
| 197975_us_ef2 | 1 | 3.0 | 2.97 | 8.9 | Open |
plot_fish_box_all <-  fish_abund %>% #tab_fish_density_prep
    filter(
      !species_code %in% c('MW', 'SU', 'NFC', 'CT', 'LSU')
    ) %>%
    ggplot(., aes(x = location, y =density_100m2)) +
    geom_boxplot()+
    facet_grid(site ~ species_code, scales ="fixed", #life_stage
               as.table = T)+
    # theme_bw()+
    theme(legend.position = "none", axis.title.x=element_blank()) +
    geom_dotplot(binaxis='y', stackdir='center', dotsize=1)+
    ylab(expression(Density ~ (Fish/100 ~  m^2))) +
    ggdark::dark_theme_bw()

plot_fish_box_all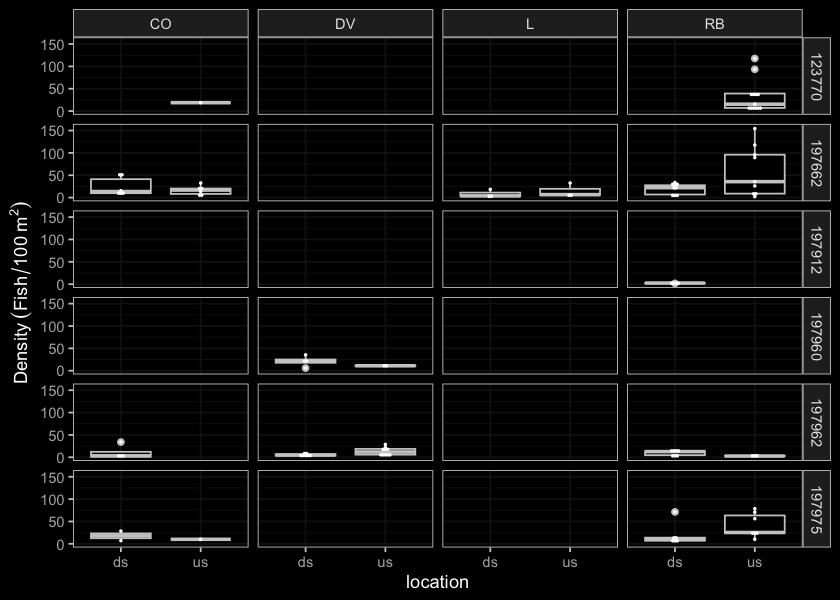
Figure 4.6: Boxplots of densities (fish/100m2) of fish captured by electrofishing during habitat confirmation assessments.
4.4 Phase 3
Engineering designs have been completed for replacement of PSCIS crossing 58159 on McDowell Creek (Irvine 2021) with a clear-span bridge and for removal of the collapsed bridge (PSCIS crossing 197912) on Robert Hatch Creek. Designs for McDowell and Robert Hatch were procured by SERNbc and Canadian Wildlife Federation respectively. At the time of reporting, the Ministry of Transportation and Infrastructure was in the process of procuring designs for remediation of fish passage at three sites documented in Irvine (2021) including PSCIS 123445 on Tyhee Creek, PSCIS 124500 on Helps Creek and PSCIS 197640 on a tributary to Buck Creek. Additionally, the Ministry of Transportation and Infrastructure were procuring a design for PSCIS crossing 124420 on Mission Creek (a.k.a Station Creek) in Hazleton (pers. comm. Sean Wong, Environmental Programs, MoTi). Details for the habitat confirmation of Mission Creek are included in the associated appendix of this report.
4.5 Phase 4
Ministry of Forest engineers collaborated with Canfor and Coastal Gaslink to replace crossing 197962 on Peacock Creek located on the Morice FSR within the Morice River watershed group. As detailed in the associated attachment within this report, baseline effectiveness monitoring including multipass electrofishing at three closed sites both upstream and downstream of the FSR in the fall of 2021 before the bridge install occurred.